[et_pb_section fb_built=”1″ admin_label=”section” _builder_version=”4.16″ da_disable_devices=”off|off|off” global_colors_info=”{}” da_is_popup=”off” da_exit_intent=”off” da_has_close=”on” da_alt_close=”off” da_dark_close=”off” da_not_modal=”on” da_is_singular=”off” da_with_loader=”off” da_has_shadow=”on”][et_pb_row admin_label=”row” _builder_version=”4.16″ background_size=”initial” background_position=”top_left” background_repeat=”repeat” global_colors_info=”{}”][et_pb_column type=”4_4″ _builder_version=”4.16″ custom_padding=”|||” global_colors_info=”{}” custom_padding__hover=”|||”][et_pb_text admin_label=”Text” _builder_version=”4.17.4″ background_size=”initial” background_position=”top_left” background_repeat=”repeat” hover_enabled=”0″ global_colors_info=”{}” sticky_enabled=”0″]
Chris Kamykowski, CFA, CFP® | Head of Investment Strategy and Research
Rich McDonald, MBA | Head of Fixed Income and Portfolio Management
The first quarter of 2022 provided plenty of fodder for the markets to contend with, from historically high inflation levels and the reversal of the Federal Reserve’s (Fed) accommodative monetary policy to the disruption of world order via the Russian invasion of Ukraine. Now another element has made its way onto the radar of investors: the dreaded yield curve inversion. In this quick post, we will provide color on what an inversion is, why there is concern, and how to properly assess the risk that markets believe an inversion is forecasting.
What is a yield curve inversion?
When looking at the US Treasury yield curve, maturities range from one month to 30 years, with yields typically rising as one goes further out on the curve; this is characterized as upward sloping and is the most common shape. Longer yields are impacted more by inflation expectations, demand/supply, and uncertainty of time, which require a higher yield to compensate investors. Shorter-term yields are driven largely by the Fed’s monetary policy.
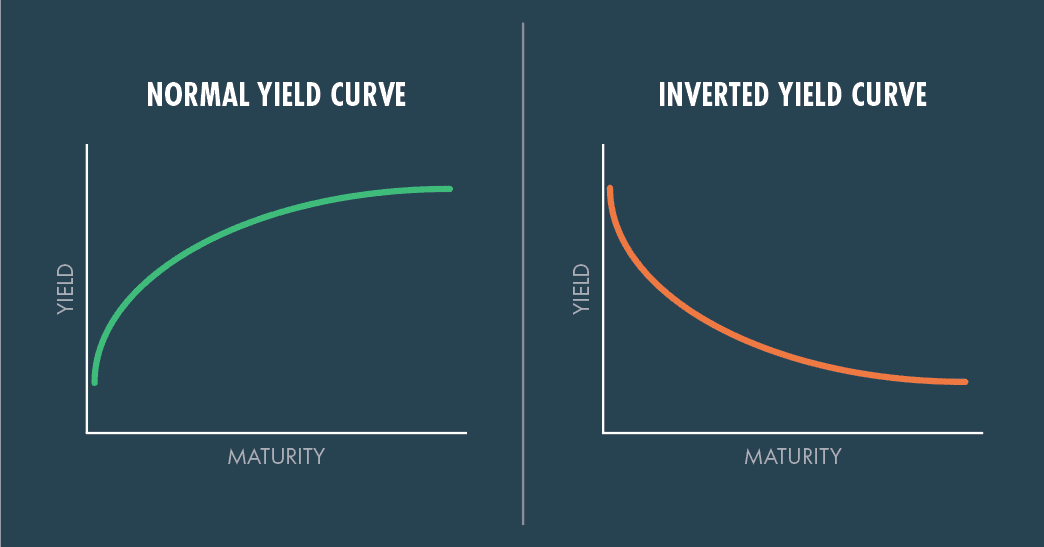
The upward sloping nature also can be described in degrees of steepness by taking the difference between one point of the curve versus another (e.g. the difference between the 10-year yield and the 2-year yield). Over the economic cycle, it is common for the slope of the yield curve to shift as conditions change. Typically, this “spread” is distinctly positive, but the curve can become flatter as the difference narrows. Less frequent is when the curve inverts when the shorter-term yield exceeds that of the longer-term yield. This is exactly what markets are focused on today.
What causes the yield curve to invert?
The primary catalyst to a yield curve inversion is the Fed’s change in monetary policy from loosening rates (lowering the Fed Funds rate) to tightening (raising the Fed Funds rate), which is primarily felt on the short end of the curve. This typically occurs when the Fed believes the economy requires less monetary stimulus given overall growth is healthy and expanding while unemployment is low. Additionally, the Fed’s dual mandate encompasses maximizing employment and minimizing the impact of rising inflation (especially, investors’ expectations of future inflation). With a tight labor market, the Fed’s rate hikes are focused on taming inflation.
How often have inversions happened with the US yield curve?
The most often-cited part of the curve that markets watch is the spread between the 10-year and 2-year Treasury bonds (“2-10 spread”). Since 1978, this part of the curve has inverted six times prior to the last six recessions; typically, each recession occurred within 6-36 months of the inversion. This historical pattern has led to concern in markets recently given the narrowing of the 2-10 spread, which saw an intra-day inversion on Tuesday, March 29, 2022.
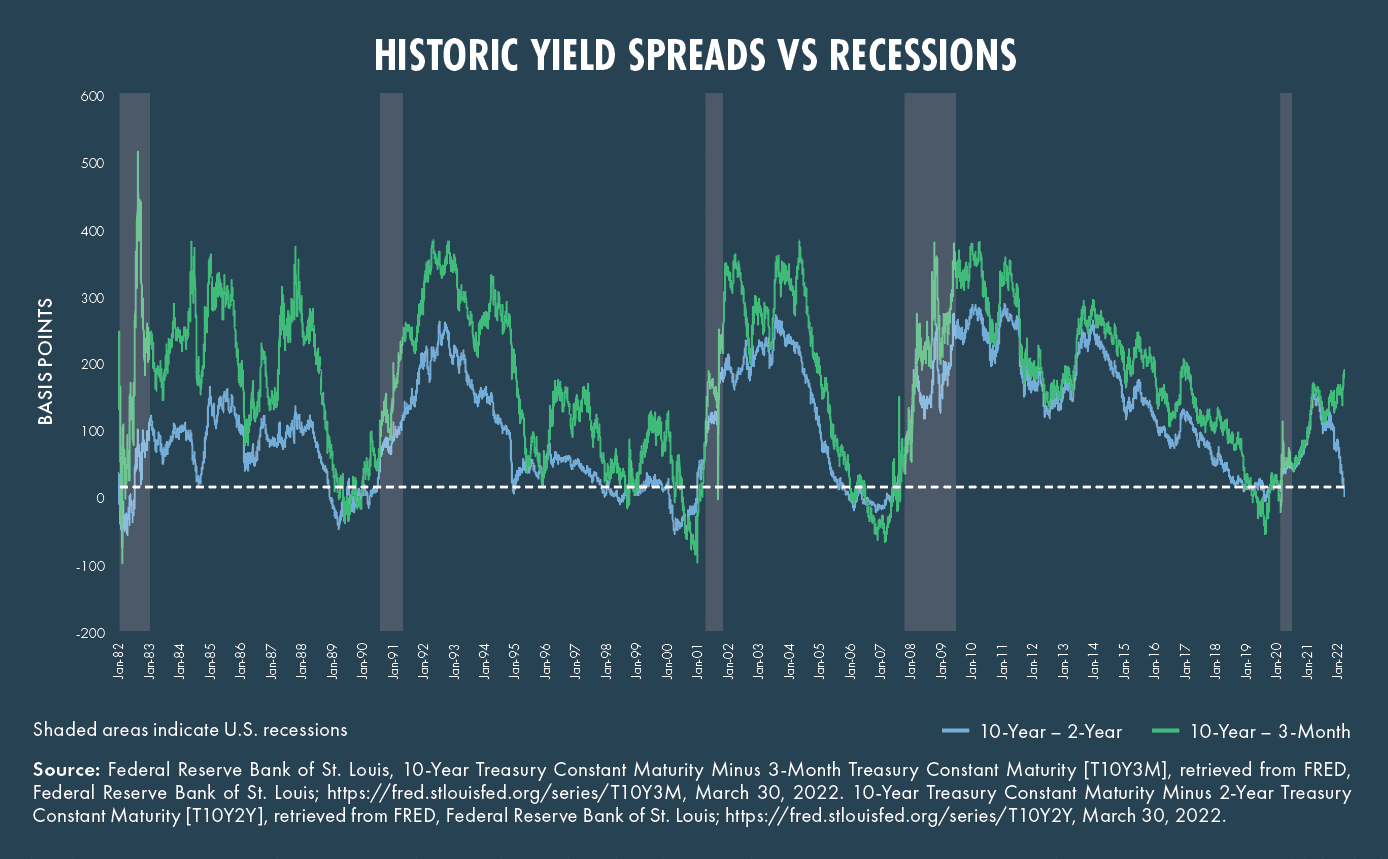
*For the above chart: See important disclosures at the end of this article.
How have markets performed after a yield curve inversion?
Even as markets fret about yield curve inversions, the months following curve inversions typically see positive performance.
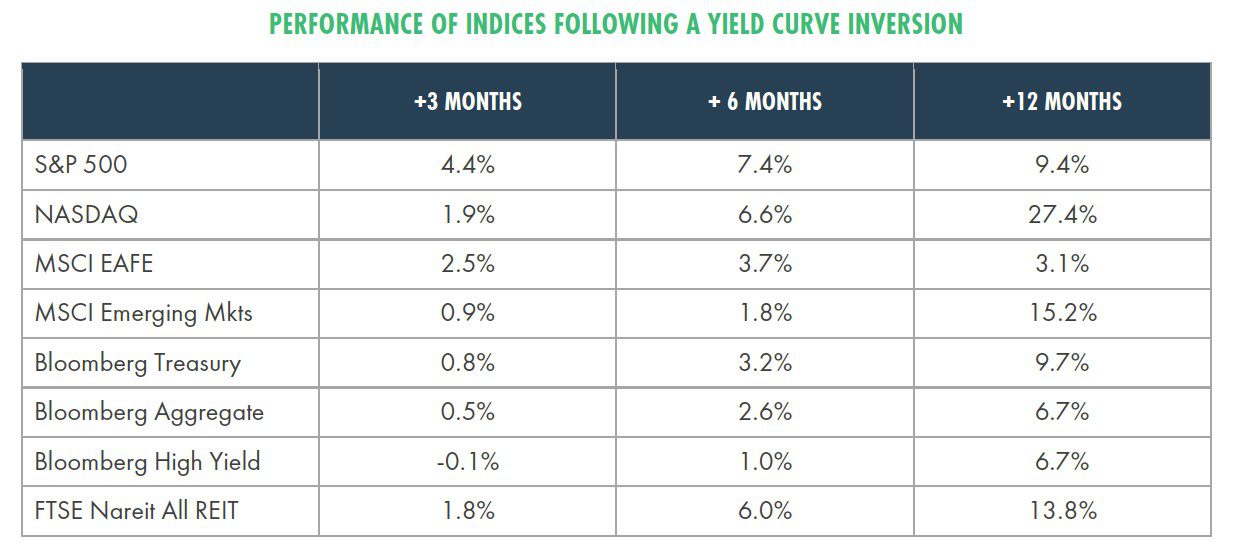
Source: Morningstar; time periods represent inversions from 1978 – 2022. Given varying inception dates of the indices, not all indices had performance during each inversion over the period selected.
Considerations to be aware of regarding yield curve inversions
At a minimum, there are several caveats to be aware of with this specific data before making wholesale changes to your portfolio:
- First, while the 2-10 spread is one the market will focus the most on, recent Federal Reserve research has questioned the importance of this particular spread versus other parts of the curve1. They noted statistical evidence that the 2-10’s predictive power is not what it seems or “spurious” at best. Another yield curve slope the Fed favors to track is the difference in the 10-year Treasury and the 3-month T-Bill. This currently shows a positive slope of approximately 180 bps and far from an inversion.
- Second, the New York Fed has built a model utilizing the 10-year/3-month spread to calculate the probability of a recession 12 months ahead. Its most recent reading shows that probability at 6%2.
- Third, it is best to think of the inversion as a signal of late-cycle economic conditions more so than a forecaster of a pending recession. As noted previously, the time between a previous inversion and a recession is up to 36 months. This is significant if one takes a bearish position today, waiting for the recession to come all while the markets continue to outperform. In addition, it’s fair to question if a brief inversion is the same as a prolonged inversion in the curve.
- Finally, other factors have been at play in the past when a recession followed an inversion., Did the 2-10’s spread predict other economic or market events that pushed an economy into a recession? The most recent example of this is the late-summer 2019 curve inversion, which was then followed by the COVID-induced economic shutdown and steep recession. It’s hard to believe anyone saw that particular recession coming.
Conclusion
With inflation running at some of the highest levels since the early 1980’s, the Fed has signaled their intention to raise rates aggressively to tame inflation. With short-term rates up sharply, the curve has become very flat and created concern over the signal that inversions seem to represent. However, as noted previously, not all inversions are created equal. While recessions have occurred after previous inversions, there can be many months of market outperformance before the start of contraction in the economy.
What should an investor do? First, the ”upside” of rising rates is potential tax-loss harvesting in your fixed income portfolio given the sharp increase in yields and subsequent fall in prices. Second, and more importantly, remain committed to a long-term, strategic approach following an investment plan designed with your goals and risk tolerance in mind. Maintain a portfolio that is properly diversified to weather volatility and uncertainty the market will undoubtedly experience throughout each year. This strategic approach is aimed at preventing short-term allocation shifts over near-term events, which can create unnecessary drag on long-term investment results.
Definitions:
The S&P 500 Index is a free-float capitalization-weighted index of the prices of 500 large-cap common stocks actively traded in the United States.
The NASDAQ Composite Index is a market capitalization weighted index with more than 3000 common equities listed on the NASDAQ Stock Market.
The MSCI EAFE Index is a free float-adjusted market capitalization index designed to measure the equity market performance of developed markets, excluding the U.S. and Canada.
The MSCI Emerging Markets Index is a float-adjusted market capitalization index that consists of indices in 21 emerging economies.
The Bloomberg U.S. Treasury Bond Index includes public obligations of the US Treasury, ie US government bonds. Certain Treasury bills are excluded by a maturity constraint. In addition, certain special issues, such as state and local government series bonds (SLGs), as well as U.S. Treasury TIPS, are excluded.
The Bloomberg U.S. Aggregate Bond Index is an index, with income reinvested, generally representative of intermediate-term government bonds, investment grade corporate debt securities and mortgage-backed securities.
The Bloomberg US Corporate High Yield Bond Index measures the USD-denominated, high yield, fixed-rate corporate bond market. Securities are classified as high yield if the middle rating of Moody’s, Fitch and S&P is Ba1/BB+/BB+ or below. Bonds from issuers with an emerging markets country of risk, based on the indices’ EM country definition, are excluded.
The FTSE Nareit All Equity REITs Index is a free-float adjusted, market capitalization-weighted index of U.S. equity REITs. Constituents of the index include all tax-qualified REITs with more than 50 percent of total assets in qualifying real estate assets other than mortgages secured by real property.
Sources:
1 Engstrom, Eric C., and Steven A. Sharpe (2022). “(Don’t Fear) The Yield Curve, Reprise,” FEDS Notes. Washington: Board of Governors of the Federal Reserve System, March 25, 2022, https://doi.org/10.17016/2380-7172.3099.
2 Federal Reserve Bank of New York, The Yield Curve as a Leading Indicator, https://www.newyorkfed.org/research/capital_markets/ycfaq.html
© 2022 Moneta Group Investment Advisors, LLC. All rights reserved. These materials were prepared for informational purposes only based on materials deemed reliable, but the accuracy of which has not been verified; trademarks and copyrights of materials referenced herein are the property of their respective owners. Examples contained herein are for illustrative purposes only based on generic assumptions. Given the dynamic nature of the subject matter and the environment in which this communication was written, the information contained herein is subject to change. This is not an offer to sell or buy securities, nor does it represent any specific recommendation. You should consult with an appropriately credentialed professional before making any financial, investment, tax or legal decision. You cannot invest directly in an index. Past performance is not indicative of future returns. All investments are subject to a risk of loss. Diversification and strategic asset allocation do not assure profit or protect against loss in declining markets. These materials do not take into consideration your personal circumstances, financial or otherwise
[/et_pb_text][/et_pb_column][/et_pb_row][/et_pb_section]