Aoifinn Devitt – Chief Global Market Strategist
It brought tears of joy, and highway tailbacks for hours. Monday’s total lunar eclipse was an almost spiritual experience for those lucky enough to be in its path, and the moment of cosmic perfection seemed like a pause for breath amid an increasingly frenetic backdrop.
Markets, too, are experiencing a total eclipse – or a near total one – by US stocks broadly and a select few stocks in particular. According the Financial Times and MSCI, the US share of developed markets, as measured by the MSCI World Index, now exceeds 70% of the global stock market index, leading passive vehicles focused on global exposure to become increasingly distorted. But the weight of capital in these indices has continued to grow – and the total assets in passive funds has now matched the total assets in active funds (both c. $13 trillion) for the first time – passive stock funds had already exceeded equity funds. Flows continue to tell a story – Large-cap growth funds saw a net $38.3 billion move to passive funds while active lost $91.2 billion in 2023 according to data from Morningstar. So, this cycle of flows chasing performance is likely to create ever more concentrated indices as market caps swell.
Recent stock market performance has been mixed as the chart below shows:
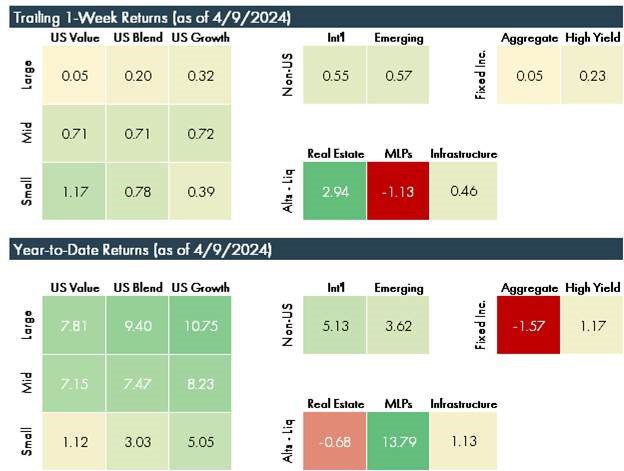
Markets were focused on jobs in recent sessions, which continue to surprise on the upside – work weeks were marginally longer and labor participation was slightly higher – all healthy signs for an economy that is bursting with life. S&P 500 earnings have been growing for three quarters now (year on year) although this is at a top level, and not uniform across sectors. As jobs surprised on the upside, yields closed higher as expectations of rate cuts were tempered.
We have talked a lot about shapes as we think about the trajectory of interest rates, inflation and the recovery of the economy (e.g. V shaped, U shaped, L shaped, K shaped) and inflation. While inflation did in fact look like an inverted V – a steep rise, followed by a steep fall – the interest rate visual has more often been compared to Capetown’s famed “Table Mountain”. We are now in the pause or “hold” stage – so on the table and looking at a period of flat rates ahead. Some commentators have raised concern about this – while the steep rise in rates occurred over a relatively short period of time, this period of pausing seems to be indefinite, particularly as economic data continues to be positive. An indefinite time on the table – or more or less on the table – if rate cuts are only modest – could point to a protracted period of tight monetary policy, which will become more and more restrictive as time goes on – and as inflation remains subdued.
The inflation picture, meanwhile, is still not fully clear as despite headline numbers that show conformity with the “inflation is under control” thesis, the non-core elements – fuel and food – which are stripped out because of their volatility – continue to provide noise on the sidelines. Oil has been more volatile of late as the situation in the Middle East starts to encroach upon domestic political support, while food prices are still showing significant compound growth – with the Wall Street journal claiming a basket of staples has risen 37% since 2019, including cooking oil (up 54% over that period).
The economic data seems strong, but investors are wise to stay cautious. Resisting big changes based on hype and momentum is key in the light of euphoria. It’s dangerous to look straight at the sun.
© 2024 Advisory services offered by Moneta Group Investment Advisors, LLC, (“MGIA”) an investment adviser registered with the Securities and Exchange Commission (“SEC”). MGIA is a wholly owned subsidiary of Moneta Group, LLC. Registration as an investment adviser does not imply a certain level of skill or training. The information contained herein is for informational purposes only, is not intended to be comprehensive or exclusive, and is based on materials deemed reliable, but the accuracy of which has not been verified.
Trademarks and copyrights of materials referenced herein are the property of their respective owners. Index returns reflect total return, assuming reinvestment of dividends and interest. The returns do not reflect the effect of taxes and/or fees that an investor would incur. Examples contained herein are for illustrative purposes only based on generic assumptions. Given the dynamic nature of the subject matter and the environment in which this communication was written, the information contained herein is subject to change. This is not an offer to sell or buy securities, nor does it represent any specific recommendation. You should consult with an appropriately credentialed professional before making any financial, investment, tax or legal decision. An index is an unmanaged portfolio of specified securities and does not reflect any initial or ongoing expenses nor can it be invested in directly. Past performance is not indicative of future returns. All investments are subject to a risk of loss. Diversification and strategic asset allocation do not assure profit or protect against loss in declining markets. These materials do not take into consideration your personal circumstances, financial or otherwise.