Chris Kamykowski CFA®, CFP® | Head of Investment Strategy & Research
Tim Side CFA® | Research Analyst
Macro Overview
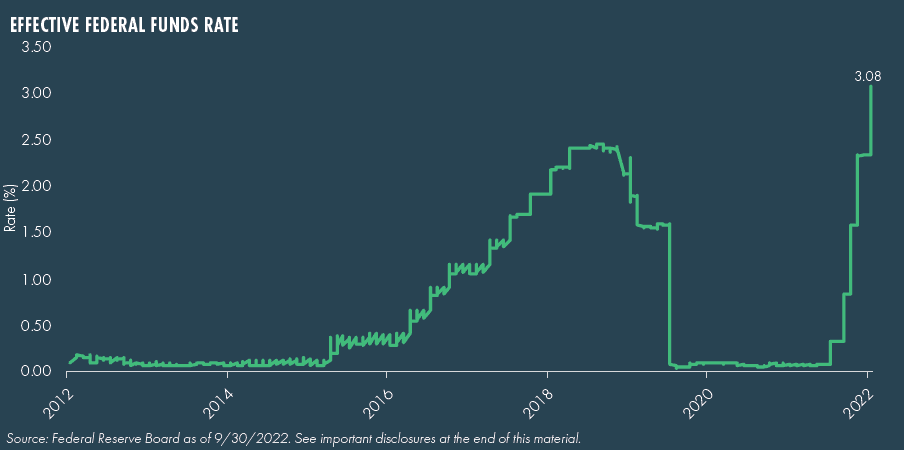
The US Federal Reserve was at the heart of the storyline over the quarter as it communicated its commitment to tightening monetary policy to help wrest control of spiraling inflation. While lower than June levels, inflation concerns remained at the forefront of investors’ minds as September saw an 8.2% year-over-year increase in the Consumer Price Index (CPI). Despite potential for negative economic impact, the Federal Reserve raised the target federal funds rate range by 75 basis points in July and another 75 basis points in September. As of September 30th, the effective federal funds rate was 3.08%, a sharp increase from 0.08% at the beginning of the year. The Fed’s median expectations for the terminal federal funds rate by year-end rose to 4.375%, indicating additional rate hikes are likely this year. While the “transitory” language has all but disappeared from Fed communications, the market’s forward expectations for inflation remain stable.
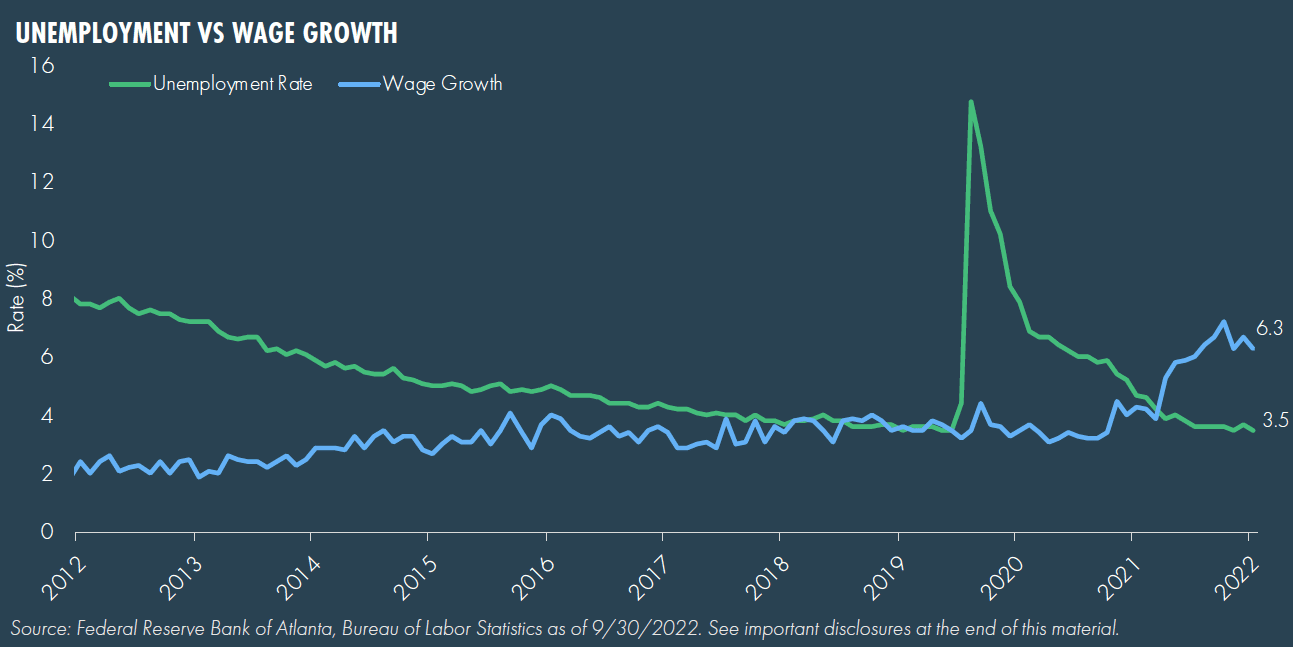
The Fed feels it has some room to tighten aggressively given the overall strength in the labor market, which ended the quarter with an unemployment rate of 3.5%. While not quite keeping pace with inflation, wages continued to improve, as median wages grew 6.3% year-over-year.
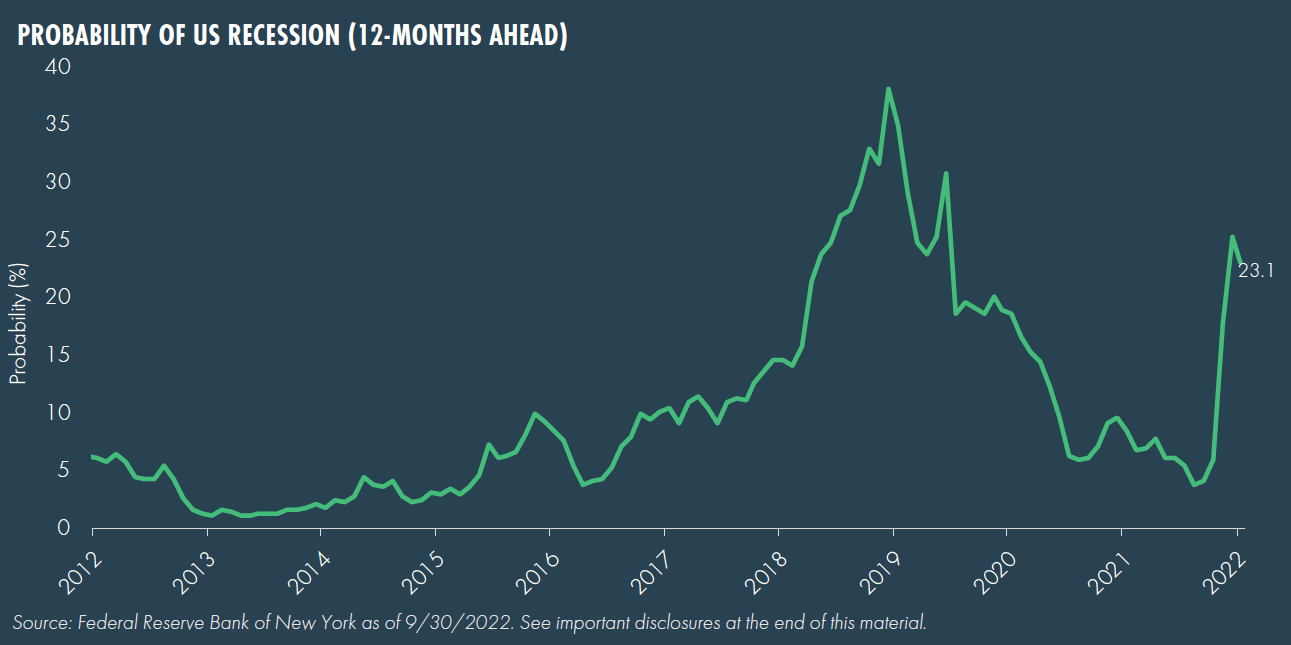
Recession fears in the United States remain elevated, although investor attention was largely on Europe, where the energy crisis has created potentially dire prospects for economic growth. The US’s relative economic strength, aided by an aggressive monetary policy, sent the US dollar to 20-year highs relative to other currencies. The euro and British pound made headlines in July and September respectively for near parity with the dollar (euro briefly fell below) as the European Central Bank and Bank of England faced the balancing act of tighter monetary policy while seeking to ease financial conditions for some of the more challenged countries.
Asset Class Performance
After a brief respite in July, Treasury yields continued their march higher, putting pressure on fixed income assets and driving the Bloomberg Aggregate Bond Index lower (-4.8%) over the quarter. High yield credit outperformed Treasuries and the Bloomberg Aggregate Index due to its shorter duration profile and risk-on rally in July. Meanwhile, US REITs fell over the third quarter with no sector able to avoid the impact of rising rates, a slowing housing market and lower outlook for earnings. Additionally, infrastructure was unable to provide downside protection versus other risk assets this quarter; key to this was rising rates and concerns over slower economic growth. MLPs were the best performing asset class, as strong cash flows and disciplined management teams helped push the Alerian MLP Index 8.1% higher.
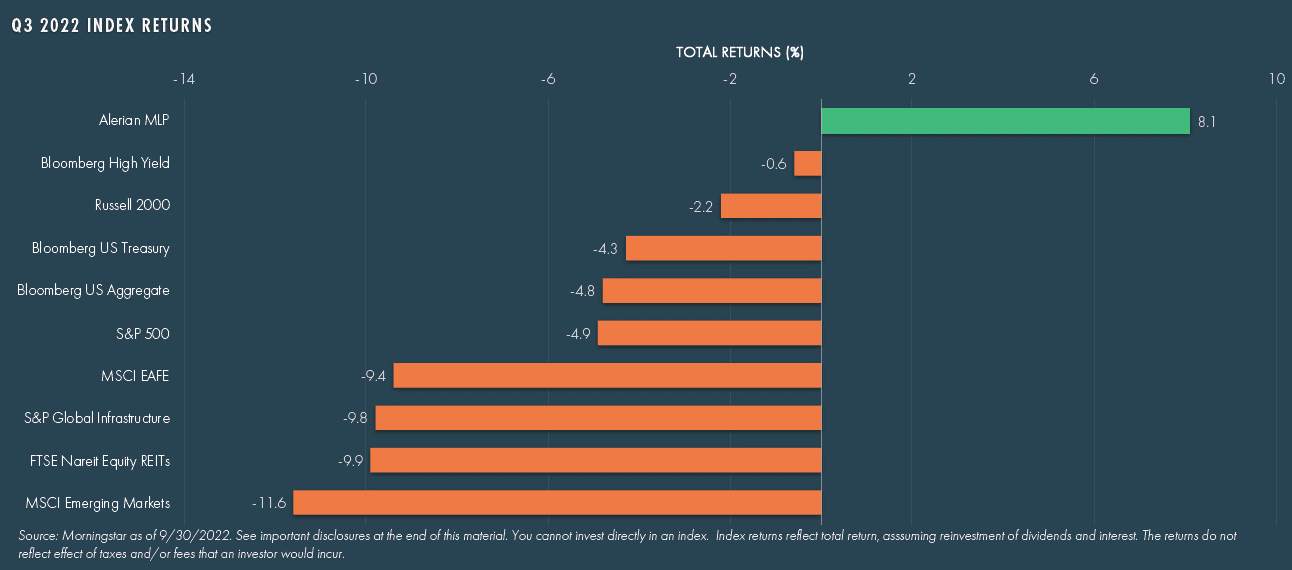
Equity markets generally underperformed fixed income, while within equities, the US outperformed non-US equities, primarily due to a strengthening dollar. China was one of the worst performing countries as Covid and regulatory uncertainty drove the MSCI China NR Index more than 20% lower. China’s poor performance weighed heavily on emerging market equities, as the country makes up roughly one-third of the MSCI Emerging Markets Index.
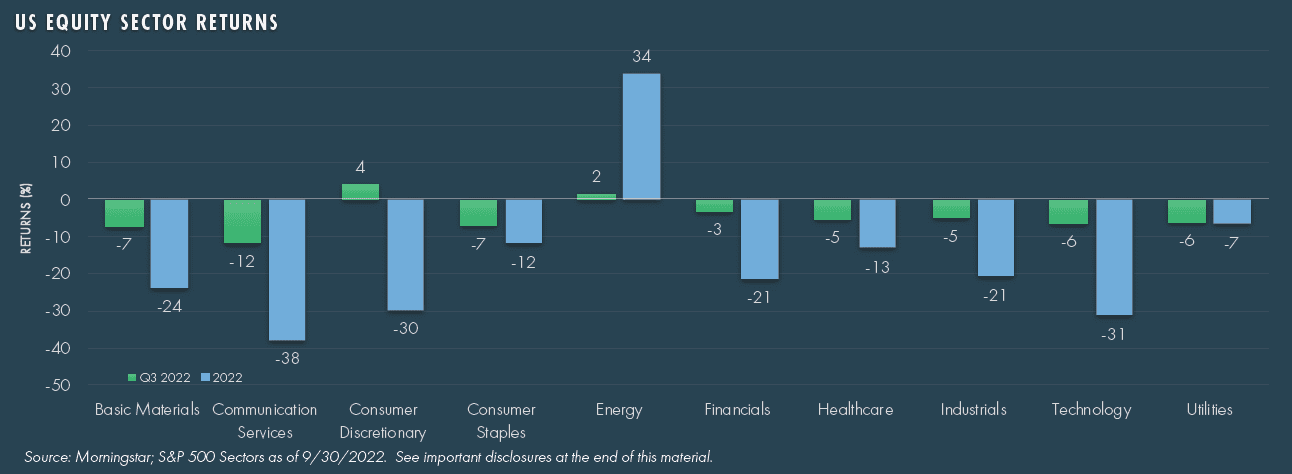
Energy and consumer discretionary were the only positive sectors in the S&P 500 Index as the index fell 4.9% over the quarter. Communication services was the worst performing sector in the index, falling 12%.
Final Thoughts
2022 is quickly coming to an end, something most investors likely welcome given the total, and unique, carnage experienced across equity and fixed income markets. Luckily, as we write, October has provided yet another bear-market rally with risk-markets significantly higher, removing some of the sting of a difficult third quarter and year. That said, uncertainty still remains as US voters head to election polls, the Fed navigates just when to “pivot” in the face of persistent inflation, recession probabilities continue to trend higher and a diplomatic solution to the war in Ukraine appears unlikely. This all makes for a dour outlook overall; however, for all the doom and gloom, valuations across markets largely reflect this, especially in equity markets. Although we do not think that timing the market is a sustainable, wealth-creating approach, long-term investors may do well to be thoughtfully “greedy” when others and markets are fearful, potentially providing a foundation for attractive future long-term returns for a diversified multi-asset portfolio.
Definitions & Disclosure
Alerian MLP Index: The Alerian MLP Index is a capped, float-adjusted, capitalization-weighted index, whose constituents earn the majority of their cash flow from midstream activities involving energy commodities.
Bloomberg US Aggregate: The Bloomberg Barclays US Aggregate Bond Index is a broad-based flagship benchmark that measures the investment grade, US dollar-denominated, fixed-rate taxable bond market.
Bloomberg High Yield: The Bloomberg Barclays US Corporate High Yield Bond Index measures the USD-denominated, high yield, fixed-rate corporate bond market.
Bloomberg US Treasury: The Bloomberg Barclays US Treasury Index measures US dollar-denominated, fixed-rate, nominal debt issued by the US Treasury.
Consumer Price Index (CPI): The Consumer Price Index is a measure of the average change over time in the prices paid by urban consumers for a market basket of consumer goods and services.
FTSE Nareit Equity REITs: The FTSE Nareit All Equity REITs Index is a free-float adjusted, market capitalization-weighted index of U.S. equity REITs. Constituents of the index include all tax-qualified REITs with more than 50 percent of total assets in qualifying real estate assets other than mortgages secured by real property.
MSCI EAFE: The MSCI EAFE Index is an equity index which captures large and mid-cap representation across 21 Developed Markets countries around the world, excluding the US and Canada.
MSCI Emerging Markets: The MSCI Emerging Markets Index captures large and mid-cap representation across 27 Emerging Markets (EM) countries.
Russell 2000: The Russell 2000 Index is a small-cap stock market index of the smallest 2,000 stocks in the Russell 3000 Index.
S&P 500: The S&P 500 Index is a free-float capitalization-weighted index of the prices of approximately 500 large-cap common stocks actively traded in the United States.
S&P Global Infrastructure: The S&P Global Infrastructure Index provides liquid and tradable exposure to 75 companies from around the world that represent the listed infrastructure universe. The index has balanced weights across three distinct infrastructure clusters: Utilities, Transportation, and Energy.
Federal funds (effective): The Fed funds rate from the Federal Reserve Bank of New York, which is updated the following morning, is available before the release of the H.15 fed funds rate which is updated the following afternoon. It can be found in the section “Interest Rates Updated Before FRB Publication”. As of March 1, 2016, the daily effective federal funds rate (EFFR) is a volume-weighted median of transaction-level data collected from depository institutions in the Report of Selected Money Market Rates (FR 2420). Prior to March 1, 2016, the EFFR was a volume-weighted mean of rates on brokered trades. All calendar days are included in monthly averages. Annualized using 360-day year or bank interest.
Unemployment Rate: The unemployment rate represents the number of unemployed as a percentage of the labor force. Labor force data are restricted to people 16 years of age and older, who currently reside in 1 of the 50 states or the District of Columbia, who do not reside in institutions (e.g., penal and mental facilities, homes for the aged), and who are not on active duty in the Armed Forces.
Wage Growth: The Atlanta Fed’s Wage Growth Tracker is a measure of the wage growth of individuals. It is constructed using microdata from the Current Population Survey (CPS), and is the median percent change in the hourly wage of individuals observed 12 months apart.
Probability of U.S. Recession: This model uses the difference between 10-year and 3-month Treasury rates to estimate the probability of a recession in the United States 12 months ahead.
© 2022 Advisory services offered by Moneta Group Investment Advisors, LLC, (“MGIA”) an investment adviser registered with the Securities and Exchange Commission (“SEC”). MGIA is a wholly owned subsidiary of Moneta Group, LLC. Registration as an investment advisor does not imply a certain level of skill or training. The information contained herein is for informational purposes only, is not intended to be comprehensive or exclusive, and is based on materials deemed reliable, but the accuracy of which has not been verified.
Trademarks and copyrights of materials referenced herein are the property of their respective owners. Index returns reflect total return, assuming reinvestment of dividends and interest. The returns do not reflect the effect of taxes and/or fees that an investor would incur. Examples contained herein are for illustrative purposes only based on generic assumptions. Given the dynamic nature of the subject matter and the environment in which this communication was written, the information contained herein is subject to change. This is not an offer to sell or buy securities, nor does it represent any specific recommendation. You should consult with an appropriately credentialed professional before making any financial, investment, tax or legal decision. An index is an unmanaged portfolio of specified securities and does not reflect any initial or ongoing expenses nor can it be invested in directly. Past performance is not indicative of future returns. All investments are subject to a risk of loss. Diversification and strategic asset allocation do not assure profit or protect against loss in declining markets. These materials do not take into consideration your personal circumstances, financial or otherwise.