
Tim Side, CFA
It is found that smaller firms have had higher risk adjusted returns, on average, than larger firms. This ‘size effect’ has been in existence for at least forty years and is evidence that the capital asset pricing model is misspecified.[1]
-Rolf W. Banz, March 1981
Outside of select Reddit threads, where users search for and collaborate on which highly indebted, poor-profit company they can pile into and drive up the price, few investors these days seem to have much interest in the unloved segment of the public stock market collectively known as “small cap” stocks. The reason is quite simple: compared to the high-flying, forward-looking tech stocks found in the Nasdaq 100 Index or private equity universe, listed small cap stocks aren’t nearly as exciting and, perhaps more importantly, don’t appear to have performed as well over the last decade.
Given the lag and variance in collecting private equity returns, we won’t have the full picture of what 2025 will look like for some time, but on the public side, while the trend has currently flipped for non-US equities, which are outperforming this year, US small cap stocks continue to lag their US large cap counterpart. There is no shortage of theories on the “why”, but for this blog post we’ll focus on what we believe to be the most likely drivers, including macroeconomic and market conditions, sector differences, and private equity.
As with any investment related topic, definitions and details matter. However, with this topic in particular, definitions and details matter a lot. As we attempt to provide some insights into the underperformance and evolution of the asset class, we’ll use the following terms quite frequently and as such thought it helpful to lay some ground rules for the discussion:
- For US Large Cap, we’ll reference the Russell 1000 Index, broadly referring to listed US equities with a market cap greater than $5 billion. For US Small Cap, we’ll reference the Russell 2000 Index, broadly referring to companies with a market cap less than $5 billion.[2] These are not technical or perfect breakpoints, but rather used as a general guide. For longer term historical data, we’ll use data from Eugene Fama and Kennth French which segments returns by market cap quintiles.
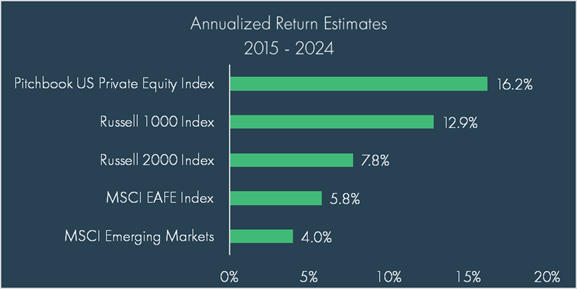
- For Private Equity, we’ll reference the Pitchbook PE All US NR USD Index, which provides time weighted return estimates (not IRR) for private equity investments, and other sources. There is not always a uniform definition for private equity, but generally, our references to private equity are broadly referring to growth, expansion, and buyout investments, typically excluding venture capital.[3]
The Theory
Academic research in the 1980s and 1990s popularized the idea of factor investing, an investment strategy that systematically tilts a portfolio towards characteristics that can influence risk and long-term return. One of the early characteristics that was “discovered” was the size effect, which noted a distinct outperformance of smaller companies over larger companies. Of course, there were different views on the “why”, but at the time, it was hard to argue against the “small cap premium” based on real performance as illustrated in the chart below.
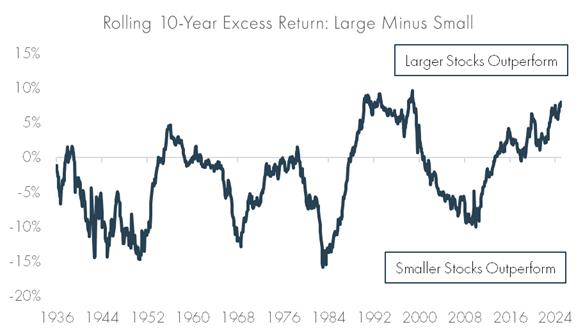
Ironically, the “40 years of evidence” noted by Rolf Banz in his breakthrough 1981 research on the relationship between return and market value of common stocks did not appear to persist in the “ex post” (after the fact), as the underperformance of large cap stocks reversed course, leading to an almost 20 year run of outperformance by large cap stocks until the tech bubble burst in the early 2000s.
Believers in the premium were rewarded in the 2000s, as small cap stocks handily outperformed large cap stocks from 2000-2009, when small cap stocks had an annualized return of 3.5% vs large cap’s annualized return of -0.5%. As we know today, this trend once again reversed, and now, looking back over the last 40 years (as of 6/30/2025), large cap stocks have had an annualized return of 10.6% vs small cap’s annualized return of 8.7%.
What Changed?
There are several dynamics about the last 40 years that make it difficult to pinpoint one reason for large cap stocks’ outperformance, but we’ll note some of the most likely drivers:
Item 1: The Macroeconomic Environment
A common (and we believe accurate) belief amongst investors is that lower rates would likely benefit small cap stocks. This is based on smaller companies typically carrying more debt – debt that is shorter dated and more exposed to rate movements given greater usage of floating rate notes – and having less flexibility to renegotiate terms and restructure existing debt, relative to their large stock counterparts.
At a high level, these principles have not necessarily changed, but they have evolved as listed small cap companies have seen a sharp rise in the number of unprofitable companies (increasing the effect of the first macro linkage) and the expansion of private credit has provided more flexibility for smaller companies (reducing the effect of the second macro linkage). All told, it’s no surprise that the sharp upward move in rates has weighed more heavily on listed small cap stocks relative to large cap and rate cuts would likely ease this headwind.
Important to note is that in a “normal” economic cycle, we typically see large cap stocks outperform small cap stocks in the late cycle (slower growth) through recession (defensive) while small caps typically outperform in the recovery (higher growth) to mid cycle (stronger risk appetite). The last 40 years have seen much longer economic cycles, and frequent extensions of “late cycle” behavior. While rate cuts would likely provide a boost to small caps in the short run, the long-term impact will be difficult to assess until there is more clarity on economic growth.
Item 2: Market Conditions
A notable feature of the recent rally has been the concentration of market winners in some of the largest names (such as the famed Magnificent 7[4]). While markets going through periods of higher concentration is not new, it has hit a new level of extreme, with the top 10 companies in the S&P 500 accounting for nearly 40% of the index, far past the “extreme” levels in the late ‘90s, when top 10 concentration rose to an estimated 28%. These types of environments will naturally favor larger cap indexes.
Item 3: Sector Differences
If asked to explain the dominance of the S&P 500 over the last several decades in one word, the answer would be obvious: technology. This is no secret, household names such as Apple, Microsoft, Facebook, Google, and the many others that make up the technology and communications sectors have been key drivers behind the stellar earnings growth and returns.
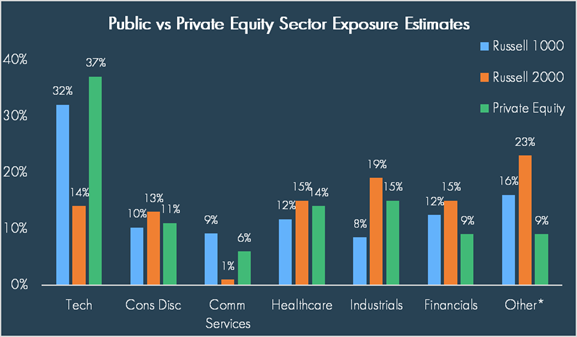
When comparing the sector exposure of large cap stocks to listed small cap stocks and private equity, there is a noticeable difference in the tech exposure, which made up less than 15% of small cap stocks as of 6/30/2024.
This has not always been the case. If we look at sector exposures in 1986 (earliest available data for the Russell 2000 Index), large cap stocks had a 13% weight to tech while small cap stocks had a 16% weight to tech. The tech bubble equalized the weightings, with tech rising to roughly 30% of both segments. In the early 2000s, the level normalized back to the mid-to-high-teens for both indexes. Only in the last 10 years have we seen the jump in tech exposure for large cap companies (to the +30% levels) while small cap companies have held steady in the mid-teens.
What sector has gained prominence in small cap stocks? Healthcare. Back in 1986, the index had a roughly 7% weight to healthcare. As seen in the chart, that has more than doubled over the last few decades.
Why does this matter? The strong performance in the tech sector over the last decade has not just been the result of investor euphoria (though there certainly is an element to that); it has been backed by strong earnings growth. Meanwhile, the healthcare sector, filled with biotech and pharma names, is notoriously unprofitable.
This is why details and definitions matter. Indexes are not the same, so clarity when defining small cap is critical. As noted earlier, the Russell 2000 Index, a commonly used proxy for US small cap stocks, has seen a significant rise in unprofitable companies. In the 1990s, roughly 20-25% of the companies in the index were unprofitable. At the end of 2024, that number had risen to 44%. Meanwhile, other indexes, such as the S&P 600[5], have profitability criteria, keeping unprofitable names in the 20-30% range over the last 30 years. Notably, the S&P 600 Index has outperformed the Russell 2000 Index by more than 1.50% annually over the last 30 years (as of 6/30/2025), indicating that a large part of small cap underperformance may simply have been due to falling profitability.[6]
Item 4: Private Equity
That all said, why has the exposure to tech stocks stayed so consistent in small cap stocks despite doubling in large cap? While the concentration of winners likely plays some role in this, the $6 trillion elephant in the room is the private equity market, where there has been significant growth over the last two decades as institutional, and now, private wealth investors, drawn in by the possibility of better returns, poured billions of dollars into the asset classes.
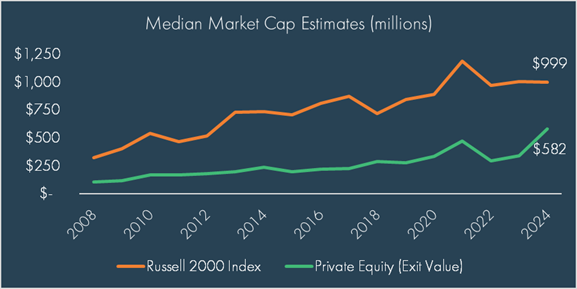
Private equity is, at the simplest level, equity ownership in a privately held company. Many, though not all, of these companies would meet our initial definition of “small cap” (i.e., less than $5 billion in size). To be sure, private equity includes very large, well-established companies including Walgreens ($40 billion) and Hub International ($29 billion). Additionally, once you include venture capital-backed companies, you also get the hot names including OpenAI ($500 billion), SpaceX ($400 billion), and Anthropic ($170 billion).[7] All told, we estimate there to be 164 private equity-backed companies and 114 venture capital-backed companies in the US with a last financing valuation of $5 billion or greater (using data from PitchBook). In a universe of more than 300,000 private companies, it is no surprise that broadly speaking, the private equity universe and subsequent exits continue to tilt towards smaller cap names.
This is also confirmed when we look at IPO data over the last 20 years. While there has been an increase in large cap (companies greater than $5 billion) IPOs, this remains a relatively small segment of the overall IPO market:
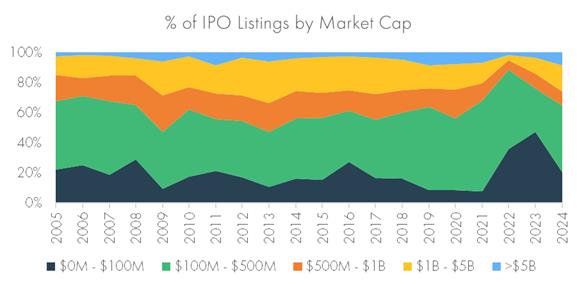
At first glance, these charts would seem to support the idea that there is a healthy level of listings for small cap companies (negating the idea that all good companies are staying private). However, there is a vital piece of the puzzle that doesn’t show up in these high-level charts that likely helps explain the relative performance difference between listed small cap stocks and private equity: while the universe overall is exiting into “small cap” territory, this is not the case for tech companies.
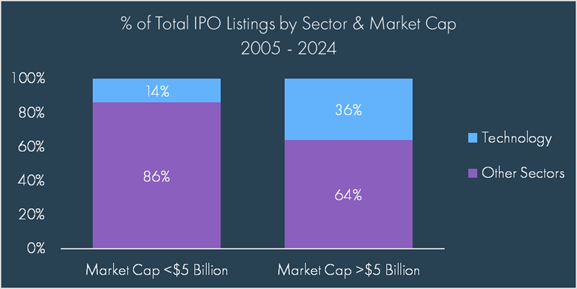
Despite making up an estimated 16% of overall IPO listing volume from 2005 through 2024, we estimate tech companies made up a disproportionate 36% of IPO listing for companies greater than or equal to $5 billion and 45% of IPO listing volume for companies greater than or equal to $10 billion – supporting the argument that technology companies are staying private longer and bypassing the listed small cap universe altogether.
With tech being the dominant sector over the last 20 years, a lack of tech companies in listed small cap stocks (in favor of private companies) has likely been a significant headwind for the sector.
What Now?
Listed small cap stocks have taken a (relative) beating over the last decade, and there are legitimate reasons for this: macro headwinds, high concentration of winners in large cap stocks, lower quality, and expanding private equity.
However, there are also legitimate reasons for holding the asset class. As noted earlier, there is an extreme level of concentration in the largest stocks, with the top 10 companies making up nearly 40% of the S&P 500 Index. Much of this is now dependent on a single tech theme: artificial intelligence (AI). Should investor exuberance for AI fade or if we start to see the market appreciate AI benefits that extend beyond the large hyperscalers, we could see a broader rally that could benefit small stocks.
We often talk about valuations, which do matter, but are very poor timing tools as markets can stay expensive for a very long time. That said, as we saw when the tech bubble burst, small cap stocks fared much better and recovered much faster, setting off a decade of outperformance relative to large cap peers.
Additionally, in recent years, we have seen a flood of new private capital offerings as general partners[8] have sought to diversify their investor base. As more capital flows into the space and competitiveness for deals impacts company valuations, we would expect to see some degradation in the broader private equity premium.
It is also notable that the last two years (2023 and 2024) saw listed US small caps stocks outperform private equity (as measured by the Pitchbook Private Equity Index). Listed stocks fell much further than estimated markdowns in private equity investments in 2022, so a larger snapback is to be expected. Nevertheless, the recent performance reversal highlights the benefits of maintaining diversification and cautions against an assumption that private equity always guarantees better returns regardless of the time horizon.
Do we expect the trend of companies staying private longer and larger to continue? Yes, most likely. Still, that does not mean a lack of solid investment opportunities in the listed equity space. While the Russell 2000 Index is notorious for its high level of unprofitable companies and weaker earnings growth, the S&P 600 Index referenced earlier has actually seen better earnings growth than the S&P 500 over the last decade.
Conclusion
At Moneta, we are strong advocates for a balanced approach to investing. We do not chase the hot trends, and avoid panic when markets selloff. Instead, we prefer to maintain diversified exposure through multiple cycles, recognizing that bubbles can often drive markets to record highs while fear can often drive them well below “fair value”.
For some investors, this balanced approach may include exposure to private capital, but it’s important to note that in addition to client specific considerations for suitability,[9] private equity is not an automatic panacea for higher returns. There is a wide dispersion in returns across private companies and private equity funds. Extreme care is necessary, and manager selection will be more important than ever.
Does this mean we should abandon listed small caps altogether? Not necessarily. Each client’s situation is unique, but in many cases, maintaining exposure to small caps remains an important part of the diversification puzzle – particularly for those who cannot, or should not, access private equity. Today’s U.S. large cap market is highly concentrated, valuations suggest lower forward-looking returns based on historical precedent, and long-term data from Fama and French show clear cycles between small- and large-cap performance. While there are strong reasons to own U.S. large caps today, risks remain, making diversification across market caps a prudent strategy.
DISCLOSURES
© 2025 Advisory services offered by Moneta Group Investment Advisors, LLC, (“MGIA”) an investment adviser registered with the Securities and Exchange Commission (“SEC”). MGIA is a wholly owned subsidiary of Moneta Group, LLC. Registration as an investment adviser does not imply a certain level of skill or training. The information contained herein is for informational purposes only, is not intended to be comprehensive or exclusive, and is based on materials deemed reliable, but the accuracy of which has not been verified.
Trademarks and copyrights of materials referenced herein are the property of their respective owners. Index returns reflect total return, assuming reinvestment of dividends and interest. The returns do not reflect the effect of taxes and/or fees that an investor would incur. Examples contained herein are for illustrative purposes only based on generic assumptions. Given the dynamic nature of the subject matter and the environment in which this communication was written, the information contained herein is subject to change. This is not an offer to sell or buy securities, nor does it represent any specific recommendation. You should consult with an appropriately credentialed professional before making any financial, investment, tax or legal decision. An index is an unmanaged portfolio of specified securities and does not reflect any initial or ongoing expenses nor can it be invested in directly. Past performance is not indicative of future returns. All investments are subject to a risk of loss. Diversification and strategic asset allocation do not assure profit or protect against loss in declining markets. These materials do not take into consideration your personal circumstances, financial or otherwise.
DEFINITIONS
The Pitchbook PE All US NR USD Index is a capital-weighted, unfrozen index that tracks the net-of-fees quarterly performance of closed-end, finite-life private equity funds in the United States in the PitchBook fund universe with available cash flow and net asset value data.
The S&P 500 Index is a free-float capitalization-weighted index of the prices of approximately 500 large-cap common stocks actively traded in the United States.
The Russell 1000® Index measures the performance of the large-cap segment of the US equity universe. It includes approximately 1,000 largest US stocks.
The Russell 2000® Index is an index of 2000 issues representative of the U.S. small capitalization securities market.
The MSCI EAFE Index is a free float-adjusted market capitalization index designed to measure the equity market performance of developed markets, excluding the U.S. and Canada.
The MSCI Emerging Markets Index is a float-adjusted market capitalization index that consists of indices in 21 emerging economies.
Fama-French portfolios are reconstructed at the end of each June using the June market equity and NYSE breakpoints. The portfolios for July of year t to June of t+1 include all NYSE, AMEX, and NASDAQ stocks for which they have market equity data for June of t. A full description of these portfolios can be found here: https://mba.tuck.dartmouth.edu/pages/faculty/ken.french/data_library.html
[1] https://www.sciencedirect.com/science/article/abs/pii/0304405X81900180?via%3Dihub
[2] For simplicity’s sake, we’ll ignore mid cap in this discussion since definitions vary widely and often span across commonly used small and large cap indexes. Additionally, cap weightings are rarely defined by a single dollar amount, and each index provider has their own inclusion criteria and rebalance windows for their respective indexes. The classification of a $5 billion company can vary across indexes (including the Russell 1000 Index and Russell 2000 Index). A complete breakdown of the Russell Index construction and methodology can be found here: https://www.lseg.com/en/ftse-russell/indices/russell-us#t-russell-3000.
[3] Seed and Venture Capital investments typically refer to early, seed stage investments; Growth and Expansion investments typically refer to scaling businesses; Buyout investments typically refer to more mature businesses; Distressed and Special Situation investments typically refer to restructuring and reengineering investments.
[4] The Magnificent 7 refers to the following seven stocks: Alphabet, Amazon, Apple, Meta, Microsoft, Nvidia, and Tesla
[5] The S&P SmallCap 600® seeks to measure the small-cap segment of the U.S. equity market. The index is designed to track companies that meet specific inclusion criteria to ensure that they are liquid and financially viable.
[6] Cliff Asness, Andrea Frazzini, Ronen Israel, Tobias Moskowitz, and Lasse Pedersen, in their January 2015 paper Size Matters, If You Control Your Junk, addressed the disappearing size premium by controlling for quality.
[7] Once again though, definitions matter. While a technical definition of “private equity” would include venture capital (which is simply put, an early-stage private investment for equity in a company), venture capital companies are often excluded from traditional private equity indexes and classifications. This could be an entire blog post on its own.
[8] The General Partner is the managing entity of a private equity fund, responsible for sourcing, evaluating, and executing investment opportunities, as well as managing and ultimately exiting those investments.
[9] Private companies are not subject to the same regulatory requirements as publicly listed companies, therefore access to these products is often limited to investors who meet certain criteria. Since these companies do not trade on an exchange, liquidity is extremely limited. Once you make an investment in a private company or private equity fund, investors often wait years before receiving any return of capital or having the ability (if any) to sell these investments.