By Aoifinn Devitt, CFP® – Chief Investment Officer
If the first quarter of the year was a somewhat wild one in terms of market volatility and sentiment swings, the second one ended with an air of relative calm. As the brutal twin blows of 2022 and the negative performance in both debt and equity markets receded farther into the rearview mirror, markets found more to like than dislike.
Artificial Intelligence (AI) moved from being a novelty to a technology that investors could grasp and envisage transforming workplaces and business models. They liked what they saw. Inflation started to moderate – at last – with energy now representing a negative contribution, and as supply chain snarl-ups started to subside, food prices fell.
US regional banks remained a conundrum, and the upset and loss of confidence in this sector in late March left a shadow that had not yet lifted. Within the broader economy, employment remained solid which bolstered the consumer, shored up spending and confidence, and placed pressure on the cost of labor. The economy’s resilience led some to question whether it was “unbreakable” and what the central bank response would have to be. The pause and probability of further hiking dominates interest rate chatter as we write.
Inflation
Inflation remains somewhat of an obsession in markets at present as it is perceived as the source code to predict monetary policy. As the chart below shows, inflation is now in a phase of decline, across most segments as can be seen in the breakdown of the Consumer Price Index (CPI).
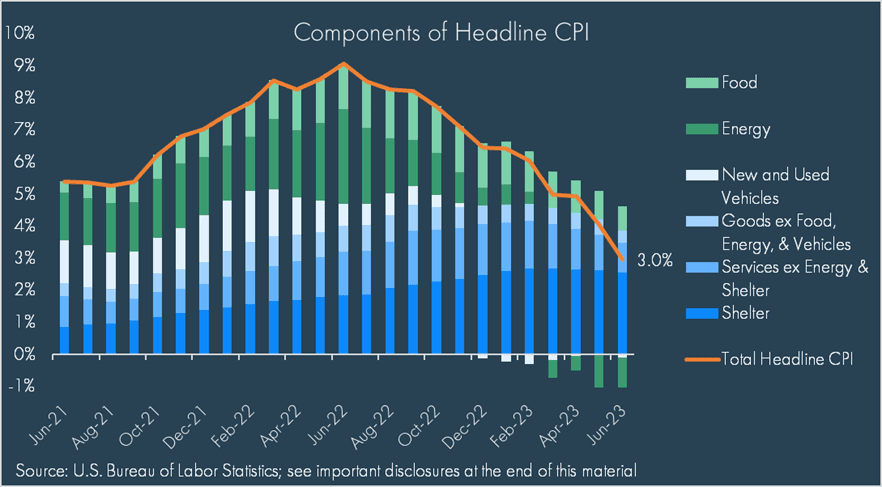
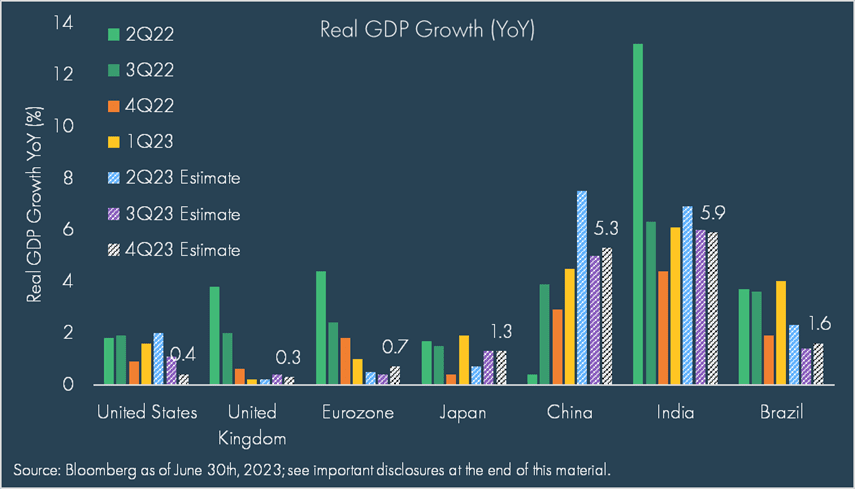
This is part of a global trend with most major economies showing the trend line dip downwards.
Much of the reduction in severity of inflation is attributable to falls in the prices of major commodities such as Brent crude, natural gas, and wheat, which have all essentially “round tripped” and are back to pre-COVID levels.
The latest CPI number, issued only this week, came in below expectations at 3% for headline inflation and 4.8% for core inflation (ex-food and energy).
Interest Rates
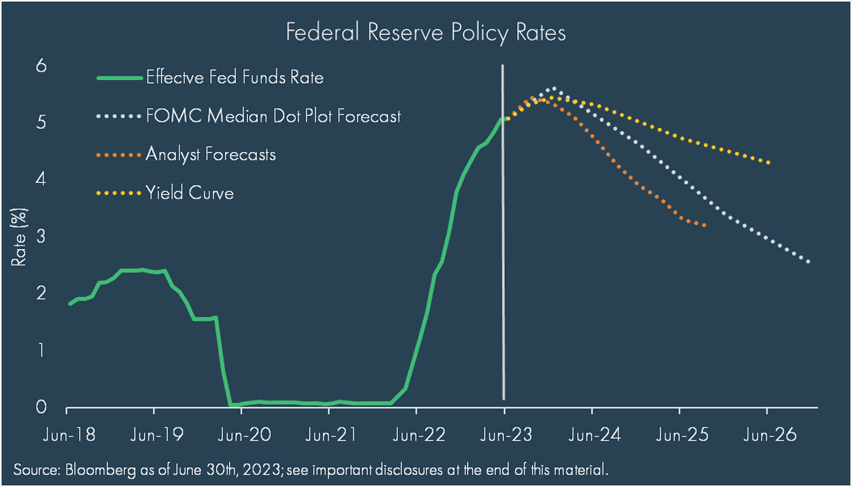
All eyes remain on interest rates. The Fed took a breath from its sharp rate rise trajectory in June and effectively “paused” rate hikes, maintaining the Fed Funds rate within a range of 5% and 5.25%. This was analyzed in-depth by market commentators and every word Fed Chairman Jerome Powell uttered at the ensuing press conferences was parsed for an indication of the next move. The Chairman took pains to stress the objective of the bank and need for “additional policy firming.” There is broad consensus that there will be at least one and most likely two further 0.25% rate hikes before the end of 2023 and that a higher-for-longer pattern can be expected. This prevails for a number of reasons: the economy can obviously withstand it, despite rising costs of credit and mortgage interest rates and there is no need to cut rates further. Yet, there are good reasons to assume that inflation is not yet fully tamed, given the propensity for more supply chain disruptions to emerge or for geopolitical surprises.
The current Fed dot plot is set out below and illustrates that a decline in rates is broadly expected by Fed members as we move into 2024 and beyond and that the yield curve will remain inverted. This traditional harbinger of a recession has flashed persistently now for months – yet the recession has only barked, not bitten.
Employment and other Macro Indicators
Most consumers look to employment as a true barometer of market health, and while the first quarter was characterized by news of lay-offs, particularly by tech companies that had grown too fast and too furiously, the second quarter saw these announcements taper off. Unemployment fell to 3.6% in June, while year-on-year wage growth started to moderate.
In contrast, for homeowners seeking to refinance or purchase a new home with a mortgage there are mixed signals – home prices have on average fallen year on year, but of course, certain popular markets still show significant strength. Meanwhile average mortgage rates are close to recent highs around 7%, representing, for some, the most meaningful direct impact of the Fed tightening cycle.
Overall economic indicators remain positive – albeit slightly, as the probability of a recession lessens in the year we have.
The US Dollar was relatively stable over the quarter, despite a rocky first quarter, and the fears of de-dollarization and attendant chatter are more muted. Some of this most likely stems from the evident strength of the US economy and the persistent uncertainties elsewhere, but it remains a strong vote of confidence.
Equity Markets Continue to Shine
The strength in large-cap growth-oriented US equities remained perhaps the most surprising trend of the quarter, and it in fact intensified over the last few weeks instead of abating. Some attribute this to AI, or investors simply welcoming the prudence and discipline shown by these companies in taking the strong medicine of layoffs and other cost reductions earlier in the year. While tech-oriented indices such as the NASDAQ outperformed more broad-based ones, most sectors started to rally as the quarter progressed and the US continued to dominate on the global stage, with Japan’s staggering performance an outlier to this trend (in local currency terms – although in USD terms it looks more subdued).
This persistent strength in equities started to draw in broader participation over the quarter as the strength in formerly lagging sectors evidenced. As investors were lured in from the sidelines, will bond funds lose some of their luster? It is possible. While, at the beginning of the year, sharply higher short-term bond yields – nearing, and then exceeding, 5% on short-term government paper – looked like a reasonable alternative to equities but, by mid-year, it looks relatively disappointing. So maybe FOMO (Fear of Missing Out) has struck again for equity investors.
Outlook
As we look to the second half of the year, an essential question will be whether the downward trend in inflation is itself transitory or likely to have staying power. This will be the key to the next phase of interest rate policy, and markets will take their cue perhaps less from this and more from the evident resilience in spending, sentiment and growth. Game changers like AI and impaired regional banks will have the ability to present positive and negative shocks while geo-politics will remain at the forefront of minds, as the war in Ukraine continues and new alliances and power centers emerge.
DISCLOSURES
© 2023 Advisory services offered by Moneta Group Investment Advisors, LLC, (“MGIA”) an investment adviser registered with the Securities and Exchange Commission (“SEC”). MGIA is a wholly owned subsidiary of Moneta Group, LLC. Registration as an investment adviser does not imply a certain level of skill or training. The information contained herein is for informational purposes only, is not intended to be comprehensive or exclusive, and is based on materials deemed reliable, but the accuracy of which has not been verified.
Trademarks and copyrights of materials referenced herein are the property of their respective owners. Index returns reflect total return, assuming reinvestment of dividends and interest. The returns do not reflect the effect of taxes and/or fees that an investor would incur. Examples contained herein are for illustrative purposes only based on generic assumptions. Given the dynamic nature of the subject matter and the environment in which this communication was written, the information contained herein is subject to change. This is not an offer to sell or buy securities, nor does it represent any specific recommendation. You should consult with an appropriately credentialed professional before making any financial, investment, tax or legal decision. An index is an unmanaged portfolio of specified securities and does not reflect any initial or ongoing expenses nor can it be invested in directly. Past performance is not indicative of future returns. All investments are subject to a risk of loss. Diversification and strategic asset allocation do not assure profit or protect against loss in declining markets. These materials do not take into consideration your personal circumstances, financial or otherwise.
DEFINITIONS
Consumer Price Index (CPI) is a measure of prices paid by consumers for a market basket of consumer goods and services. The yearly growth rates represent the inflation rate.
The federal funds rate is the interest rate at which depository institutions trade federal funds (balances held at Federal Reserve Banks) with each other overnight. When a depository institution has surplus balances in its reserve account, it lends to other banks in need of larger balances. In simpler terms, a bank with excess cash, which is often referred to as liquidity, will lend to another bank that needs to quickly raise liquidity. The rate that the borrowing institution pays to the lending institution is determined between the two banks; the weighted average rate for all of these types of negotiations is called the effective federal funds rate. The effective federal funds rate is essentially determined by the market but is influenced by the Federal Reserve through open market operations to reach the federal funds rate target.
The projections for the federal funds rate are the value of the midpoint of the projected appropriate target range for the federal funds rate or the projected appropriate target level for the federal funds rate at the end of the specified calendar year or over the longer run. Each participant’s projections are based on his or her assessment of appropriate monetary policy. The range for each variable in a given year includes all participants’ projections, from lowest to highest, for that variable in the given year. This series represents the median value of the range forecast established by the Federal Open Market Committee. For each period, the median is the middle projection when the projections are arranged from lowest to highest. When the number of projections is even, the median is the average of the two middle projections.
Effective fed funds rate analyst forecasts and real GDP forward estimates are the Bloomberg weighted averages of sell side analyst forecasts.
The U.S. Treasury yield curve refers to a line chart that depicts the yields of short-term Treasury bills compared to the yields of long-term Treasury notes and bonds. The chart shows the relationship between the interest rates and the maturities of U.S. Treasury fixed-income securities. The Treasury yield curve (also referred to as the term structure of interest rates) shows yields at fixed maturities, such as one, two, three, and six months and one, two, and three years. Because Treasury bills and bonds are resold daily on the secondary market, yields on the notes, bills, and bonds fluctuate.
Real gross domestic product is the inflation adjusted value of the goods and services produced by labor and property located in the United States.
The S&P 500 Index is a free-float capitalization-weighted index of the prices of approximately 500 large-cap common stocks actively traded in the United States.
The Russell 2000® Index is an index of 2000 issues representative of the U.S. small capitalization securities market.
The MSCI EAFE Index is a free float-adjusted market capitalization index designed to measure the equity market performance of developed markets, excluding the U.S. and Canada.
The MSCI Emerging Markets Index is a float-adjusted market capitalization index that consists of indices in 21 emerging economies.
Bloomberg U.S. Treasury Bond Index includes public obligations of the US Treasury, i.e. US government bonds. Certain Treasury bills are excluded by a maturity constraint. In addition, certain special issues, such as state and local government series bonds (SLGs), as well as U.S. Treasury TIPS, are excluded.
The Bloomberg U.S. Aggregate Bond Index is an index, with income reinvested, generally representative of intermediate-term government bonds, investment grade corporate debt securities and mortgage-backed securities.
The Bloomberg US Corporate High Yield Bond Index measures the USD-denominated, high yield, fixed-rate corporate bond market. Securities are classified as high yield if the middle rating of Moody’s, Fitch and S&P is Ba1/BB+/BB+ or below. Bonds from issuers with an emerging markets country of risk, based on the indices’ EM country definition, are excluded.
The FTSE Nareit All Equity REITs Index is a free-float adjusted, market capitalization-weighted index of U.S. equity REITs. Constituents of the index include all tax-qualified REITs with more than 50 percent of total assets in qualifying real estate assets other than mortgages secured by real property.
The S&P Global Listed Infrastructure index measures the performance of global companies that are engaged in infrastructure and related operations. It provides liquid and tradable exposure to 75 companies from around the world that represent the listed infrastructure universe. To create diversified exposure, the index includes three distinct infrastructure clusters: utilities, transportation and energy.