
February Observations
Volatility Continues on AI Disruption and Geopolitics
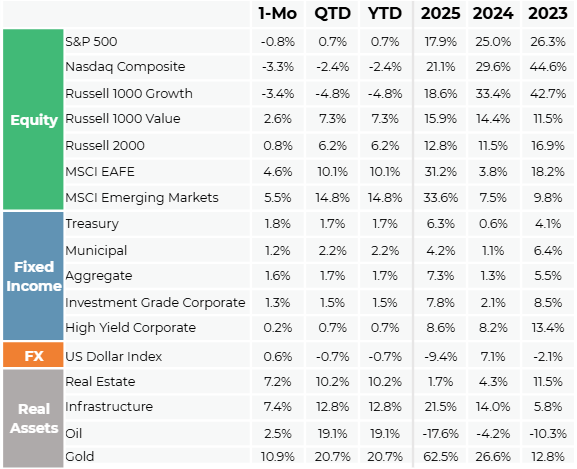
U.S. equities were mixed in February, with the S&P 500 falling 0.8% as concerns over AI disruption, tariffs, and escalating Middle East tensions weighed on sentiment. The AI narrative continued to shift sharply from optimism to fears about its impact, pressuring growth stocks while value and small caps posted gains. International markets outperformed, with MSCI EAFE returning 4.6% and emerging markets rising 5.5%, led by South Korea as semiconductor-driven exports surged. Bonds were modestly higher, with Treasuries gaining 1.8% and investment-grade and high yield corporates returning 1.3% and 0.2%, respectively. Treasury yields fell late in the month amid geopolitical risks and private credit concerns. Commodities rallied, led by gold, which gained 11% on safe-haven demand. Listed real estate rose 7.2%, continuing its recovery from 2025’s poor performance.
IEEPA Tariffs Struck Down by Supreme Court
The Supreme Court ruled last month that President Trump’s global tariffs imposed under the International Emergency Economic Powers Act (IEEPA) were invalid (sector specific Section 232 tariffs were unaffected). Hours after the Supreme Court ruling, President Trump imposed new 10% global tariffs under Section 122 of the Trade Act of 1974; later announcing plans to raise this rate further to 15%. Markets initially reacted positively as the refund process could provide a meaningful cash flow boost to importers, though the administration had not yet committed to the full refund timeline or process.
Military Escalation on Final Day of the Month
On February 28th (a Saturday), the U.S. and Israel jointly launched airstrikes against Iran’s military capabilities and leadership structure. The buildup to what has been deemed, “Operation Epic Fury”, had been ongoing with U.S. military assets moving in the Middle East over the month. As we write, the situation remains very fluid; our initial take can be found here.
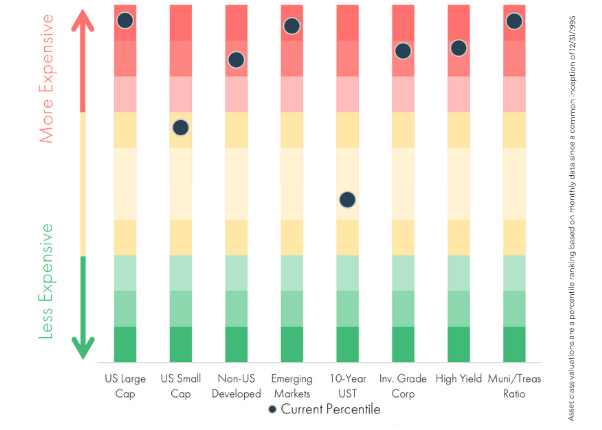
Asset Class Valuations – 2-28-2026
Asset Manager Commentary
Global Value Asset Manager
Companies should be hiring given the state of the economy, but demand remains weak. While AI replacing labor is a popular narrative weighing on staffing stocks, discussions with agencies and employers suggest a simpler explanation: companies are still unwinding pandemic-era over-hiring, leaving less need for temporary or temp-to-hire workers.
Real Estate Manager
Data center REITs were a surprise laggard in 2025, declining after two years of strong AI-driven outperformance. Earlier enthusiasm assumed a major AI capex cycle would directly boost REIT demand, but expectations proved mismatched with reality. Public REIT portfolios are broadly leased with long-term contracts and are not the primary developers of hyperscaler AI capacity, which companies like Amazon and Microsoft are largely building themselves or with private partners.
Venture Capital Manager
The current environment for early-stage companies is unusually fast-moving: new companies are reaching revenue levels that once justified major valuations, only to see that revenue evaporate within months as new technologies or competitors emerge.
Chart of the Month
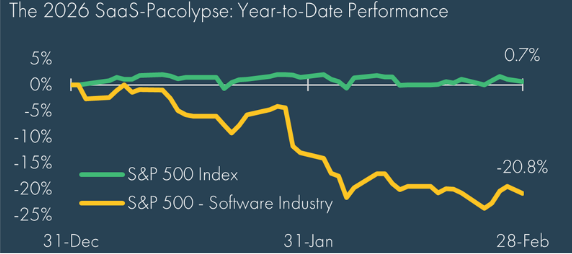
Software stocks continued to face headwinds, with the S&P 500 Software industry down more than 20% year-to-date. The selloff has coincided with a rapid cadence of AI developments, from Claude Cowork and successive model launches to new plugin integrations, intensifying fears that AI agents could disrupt traditional software.
Disclosures
© 2026 Advisory services offered by Moneta Group Investment Advisors, LLC, (“MGIA”) an investment adviser registered with the Securities and Exchange Commission (“SEC”). MGIA is a wholly owned subsidiary of Moneta Group, LLC. Registration as an investment adviser does not imply a certain level of skill or training. The information contained herein is for informational purposes only, is not intended to be comprehensive or exclusive, and is based on materials deemed reliable, but the accuracy of which has not been verified.
Trademarks and copyrights of materials referenced herein are the property of their respective owners. Index returns reflect total return, assuming reinvestment of dividends and interest. The returns do not reflect the effect of taxes and/or fees that an investor would incur. Examples contained herein are for illustrative purposes only based on generic assumptions. Given the dynamic nature of the subject matter and the environment in which this communication was written, the information contained herein is subject to change. This is not an offer to sell or buy securities, nor does it represent any specific recommendation. You should consult with an appropriately credentialed professional before making any financial, investment, tax or legal decision. An index is an unmanaged portfolio of specified securities and does not reflect any initial or ongoing expenses nor can it be invested in directly. Past performance is not indicative of future returns. All investments are subject to a risk of loss. Diversification and strategic asset allocation do not assure profit or protect against loss in declining markets. These materials do not take into consideration your personal circumstances, financial or otherwise.
Sources
Morningstar Direct, Bloomberg as of 2/28/2026
Manager comments come from discussions with various asset managers and are broad commentary on sectors and not be considered recommendations by any asset manager. These comments do not necessarily reflect strategy allocations or the view or opinion of MGIA or Moneta Group .
Definitions
The S&P 500 Index is a free-float capitalization-weighted index of the prices of approximately 500 large-cap common stocks actively traded in the United States.
The NASDAQ Composite Index is a market capitalization weighted index with more than 3000 common equities listed on the NASDAQ Stock Market.
The NASDAQ 100 Index is a modified capitalization-weighted index of the 100 largest and most active non-financial domestic and international issues listed on the NASDAQ..
The Russell 1000® Index is an index of 1000 issues representative of the U.S. large capitalization securities market.
The Russell 1000® Growth Index measures the performance of the large-cap growth segment of the U.S. equity universe. It includes those Russell 1000 companies with higher price-to-book ratios and higher forecasted growth values.
The Russell 1000® Value Index measures the performance of those Russell 1000 Index securities with lower price-to-book ratios and lower forecasted growth values, representative of U.S. Securities exhibiting value characteristics.
The Russell 2000® Index is an index of 2000 issues representative of the U.S. small capitalization securities market.
The MSCI EAFE Index is a free float-adjusted market capitalization index designed to measure the equity market performance of developed markets, excluding the U.S. and Canada.
The MSCI Emerging Markets Index is a float-adjusted market capitalization index that consists of indices in 21 emerging economies.
Bloomberg U.S. Treasury Bond Index includes public obligations of the US Treasury, i.e. US government bonds. Certain Treasury bills are excluded by a maturity constraint. In addition, certain special issues, such as state and local government series bonds (SLGs), as well as U.S. Treasury TIPS, are excluded.
The Bloomberg U.S. Municipal Index covers the USD-denominated long-term tax exempt bond market. It includes general obligation and revenue bonds, which both can be pre-refunded years later and get reclassified as such.
The Bloomberg U.S. Aggregate Bond Index is an index, with income reinvested, generally representative of intermediate-term government bonds, investment grade corporate debt securities and mortgage-backed securities.
The Bloomberg US Corporate Bond Index measures the investment grade, fixed-rate, taxable corporate bond market. It includes USD-denominated securities publicly issued by US and non-US industrial, utility and financial issuers.
The Bloomberg US Corporate High Yield Bond Index measures the USD-denominated, high yield, fixed-rate corporate bond market. Securities are classified as high yield if the middle rating of Moody’s, Fitch and S&P is Ba1/BB+/BB+ or below. Bonds from issuers with an emerging markets country of risk, based on the indices’ EM country definition, are excluded.
The US Dollar Index measures the US dollar against six global currencies: the euro, Swiss franc, Japanese yen, Canadian dollar, British pound, and Swedish krona.
The FTSE Nareit All Equity REITs Index is a free-float adjusted, market capitalization-weighted index of U.S. equity REITs. Constituents of the index include all tax-qualified REITs with more than 50 percent of total assets in qualifying real estate assets other than mortgages secured by real property.
The S&P Global Listed Infrastructure Index measures the performance of global companies that are engaged in infrastructure and related operations. It provides liquid and tradable exposure to 75 companies from around the world that represent the listed infrastructure universe. To create diversified exposure, the index includes three distinct infrastructure clusters: utilities, transportation and energy.
Brent Crude is the most traded of all of the oil benchmarks, and is defined as crude mostly drilled from the North Sea oilfields: Brent, Forties, Oseberg and Ekofisk (collectively known as BFOE).
The Dow Jones Commodity Index Gold is designed to track the gold market through futures contracts.
The ICE BofA Option-Adjusted Spreads (OASs) are the calculated spreads between a computed OAS index of all bonds in a given rating category and a spot Treasury curve. An OAS index is constructed using each constituent bond’s OAS, weighted by market capitalization. The Corporate Master OAS uses an index of bonds that are considered investment grade (those rated BBB or better). When the last calendar day of the month takes place on the weekend, weekend observations will occur as a result of month ending accrued interest adjustments.
The ICE BofA Option-Adjusted Spreads (OASs) are the calculated spreads between a computed OAS index of all bonds in a given rating category and a spot Treasury curve. An OAS index is constructed using each constituent bond’s OAS, weighted by market capitalization. The ICE BofA High Yield Master II OAS uses an index of bonds that are below investment grade (those rated BB or below).
Asset class valuations are a percentile ranking based on monthly data going back to common inception of 12/31/1995. The US Large Cap percentile is the average percentile ranking of the trailing P/E, P/B, P/S, and P/C ratio of the S&P 500 Index. The US Small Cap percentile is the average percentile ranking of the trailing P/E, P/B, P/S, and P/C ratio of the Russell 2000 Index. The International Developed percentile is the average percentile ranking of the trailing P/E, P/B, P/S, and P/C ratio of the MSCI EAFE Index. The Emerging Market percentile is the average percentile ranking of the trailing P/E, P/B, P/S, and P/C ratio of the MSCI Emerging Markets Index. The 10-Year US Treasury percentile is the percentile ranking of the 10-Year US Treasury yield. The Investment Grade percentile is the percentile ranking of the ICE BofA US Corporate option adjusted spread. The High Yield Corporate percentile is the percentile ranking of the ICE BofA US High Yield corporate option adjusted spread. The Municipal/Treasury percentile is the percentile ranking of the Bloomberg Municipal Index yield divided by the 10-Year US Treasury Yield.