After a bruising 2022, the start to 2023 unfolded with considerable uncertainty. Following the double blow that falling bond and equity valuations wrought on portfolios, it was inevitable that investors would spend some time assessing the damage. However, even in the fourth quarter of 2022, there were some indications that some of the ferociousness of market indicators was subsiding, and this continued into the first quarter of 2023. Somehow, as the first month of the year has wrapped up, things don’t seem quite as bad as forecasted only weeks prior. Let’s find out why.
Economic Overview

Easing inflation pressures started to come through in the fourth quarter, giving investors welcome respite. December saw a 6.5% year-over year increase in the Consumer Price Index (CPI), which was down from September’s 8.2%; although still elevated, this was a welcome relief from June’s 9.1% year-over-year increase. In recognition of easing inflation, the Federal Reserve began moderating the level of rate hikes, dropping from 0.75% in November to 0.5% in December. All told, 2022 saw the largest increase in the Federal Funds Rate since the early 2000s as the Fed hiked the Fed Funds seven times to a target range of 4.25% from near-zero levels. The pace of hikes is expected to continue slowing, as the Fed’s December projections show an expectation of 0.5% more in hikes in 2023 and then, if inflation falls to more sustainable levels, a decline in Fed Funds rate in 2024 and beyond.
While headlines were filled with high-profile tech layoffs, the labor market overall remained tight as the unemployment remained unchanged quarter-over-quarter at 3.5% – although the rate did tick up in October to 3.7%.
The war in Ukraine continued to weigh on the geopolitical atmosphere, but a positive market reaction to the appointment of fiscally conservative, Rishi Sunak, as the U.K.’s new Prime Minister, a warmer winter in Europe, and the relaxation of China’s Zero Covid Policy, helped improve the global economic outlook. U.S. recession fears remained elevated at the beginning of the year, albeit lower than peak concerns. Consumer stress, in the form of higher credit card balances and lower savings rates due to higher prices, has contributed to negative consumer sentiment. While supply chain issues have eased significantly, company outlooks remain dour due to concerns over the impact on earnings from higher interest rates, high wage inflation, and expectations for a slowing economy.
Market Recap

Slowing inflation and an easing in the level of rate hikes provided a tailwind for fixed income assets as the Bloomberg Aggregate Bond Index rose 1.9% over the quarter, although the marginal gain in Q4 was not enough to negate the index’s worst calendar year on record (-13.0%). Spread products saw the biggest gains over the quarter as high yield credit outperformed Treasuries, aided by tighter spreads during the risk-on rally in October and November. Equity markets outperformed fixed income, while within equities, non-U.S. equities outperformed U.S. equities, aided by a weaker dollar. In a reversal from the first three quarters, China rallied more than 36% through November and December due to a relaxation of their Zero Covid Policy, which provided a tailwind to broad emerging market equities. Developed non-U.S. markets (as represented by the MSCI EAFE Index) had the best performance over the quarter, rising 17.3% as Europe rallied on lower energy prices and a decline in inflation. The S&P 500 Index gained 7.6% over the quarter, aided by gains in the Energy sector which rose 22.8% in Q4 and 65.7% over the year. Consumer Discretionary and Communication Services lagged among the S&P 500 Index sectors in Q4, as consumer sentiment struggled and investors continued to punish mega-cap companies with high valuations and lower profitability. MLPs continued to benefit alongside the Energy sector, rising 10.1% over the quarter. Following a rough third quarter, Global Listed Infrastructure rebounded in the fourth quarter, up 10.8%, aided by strong performance from energy and utilities in addition to tailwinds in Europe.
2023 Outlook
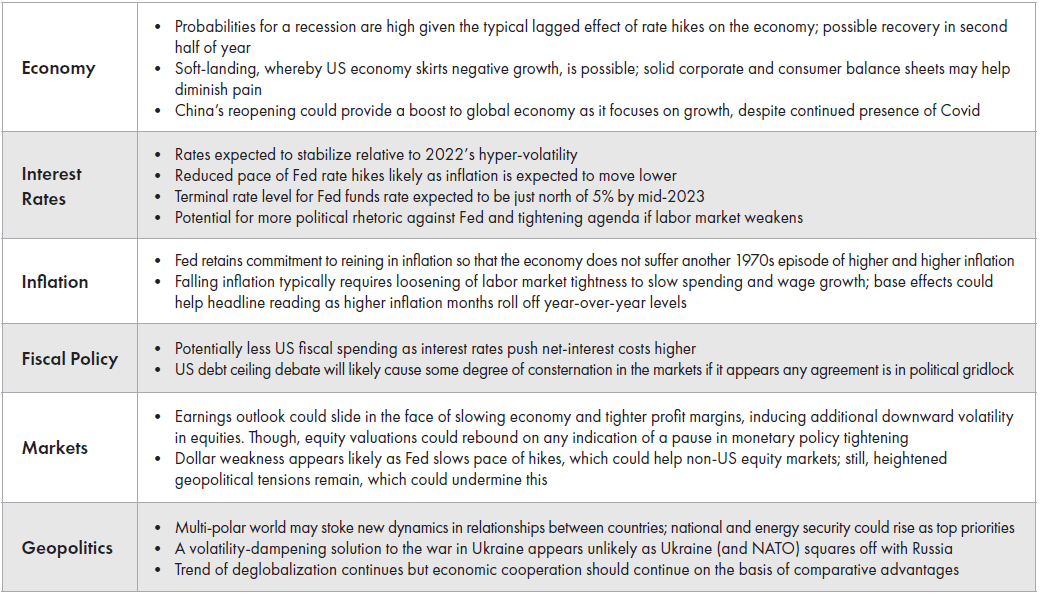
With 2022 in the rear-view mirror, 2023 brings a fresh start – although much of what affected markets in 2022 remains as we venture into the new year. Resolutions, clarity and certainty would go a long way to calming the markets, but patience is likely needed by investors given the various and complicated dynamics at play in the markets, the economy, monetary policy and geopolitics. We end this piece with a high-level overview of and comments on these elements (see table on the next page) which are likely to be on investors’ minds throughout 2023.
Definitions & Disclosure
Alerian MLP Index: The Alerian MLP Index is a capped, float-adjusted, capitalization-weighted index, whose constituents earn the majority of their cash flow from midstream activities involving energy commodities.
Bloomberg US Aggregate: The Bloomberg Barclays US Aggregate Bond Index is a broad-based flagship benchmark that measures the investment grade, US dollar-denominated, fixed-rate taxable bond market.
Bloomberg High Yield: The Bloomberg Barclays US Corporate High Yield Bond Index measures the USD-denominated, high yield, fixed-rate corporate bond market.
Bloomberg US Treasury: The Bloomberg Barclays US Treasury Index measures US dollar-denominated, fixed-rate, nominal debt issued by the US Treasury.
FTSE Nareit Equity REITs: The FTSE Nareit All Equity REITs Index is a free-float adjusted, market capitalization-weighted index of U.S. equity REITs. Constituents of the index include all tax-qualified REITs with more than 50% of total assets in qualifying real estate assets other than mortgages secured by real property.
MSCI EAFE: The MSCI EAFE Index is an equity index which captures large and mid-cap representation across 21 Developed Markets countries around the world, excluding the US and Canada.
MSCI Emerging Markets: The MSCI Emerging Markets Index captures large and mid-cap representation across 27 Emerging Markets (EM) countries.
Russell 2000: The Russell 2000 Index is a small-cap stock market index of the smallest 2,000 stocks in the Russell 3000 Index.
S&P 500: The S&P 500 Index is a market-capitalization-weighted index of the 500 largest domestic U.S. stocks.
S&P Global Infrastructure: The S&P Global Infrastructure Index provides liquid and tradable exposure to 75 companies from around the world that represent the listed infrastructure universe. The index has balanced weights across three distinct infrastructure clusters: Utilities, Transportation, and Energy.
The Consumer Price Index for All Urban Consumers: All Items (CPIAUCSL) is a price index of a basket of goods and services paid by urban consumers. Percent changes in the price index measure the inflation rate between any two time periods. The most common inflation metric is the percent change from one year ago. It can also represent the buying habits of urban consumers. This particular index includes roughly 88% of the total population, accounting for wage earners, clerical workers, technical workers, self-employed, short-term workers, unemployed, retirees, and those not in the labor force.
© 2023 Advisory services offered by Moneta Group Investment Advisors, LLC, (“MGIA”) an investment adviser registered with the Securities and Exchange Commission (“SEC”). MGIA is a wholly owned subsidiary of Moneta Group, LLC. Registration as an investment advisor does not imply a certain level of skill or training. The information contained herein is for informational purposes only, is not intended to be comprehensive or exclusive, and is based on materials deemed reliable, but the accuracy of which has not been verified.
Trademarks and copyrights of materials referenced herein are the property of their respective owners. Index returns reflect total return, assuming reinvestment of dividends and interest. The returns do not reflect the effect of taxes and/or fees that an investor would incur. Examples contained herein are for illustrative purposes only based on generic assumptions. Given the dynamic nature of the subject matter and the environment in which this communication was written, the information contained herein is subject to change. This is not an offer to sell or buy securities, nor does it represent any specific recommendation. You should consult with an appropriately credentialed professional before making any financial, investment, tax or legal decision. An index is an unmanaged portfolio of specified securities and does not reflect any initial or ongoing expenses nor can it be invested in directly. Past performance is not indicative of future returns. All investments are subject to a risk of loss. Diversification and strategic asset allocation do not assure profit or protect against loss in declining markets. These materials do not take into consideration your personal circumstances, financial or otherwise.