Tim Side, CFA, Research Analyst
With the March Federal Open Market Committee (FOMC) meeting behind us, the day of reckoning for the Federal Reserve is quickly approaching. In what was the least predictable FOMC meeting in recent history, the March meeting saw the Fed implement a dovish rate hike that acknowledged the risks present in the market while moving forward with higher rates in their attempt to bring down inflation.
As it stood at the end of the month, the Fed expects one more 0.25% hike in 2023, and then lower Federal Funds rates in 2024. The bond market is pricing in a potential rate hike in May and then a potential cut as soon as July of 2023.
The difference in market expectations versus the Fed’s expectations for the path of rates is setting up an interesting dynamic. Essentially, the bond market is telling us that a recession is coming soon and rates will fall. The stock market is telling us that a recession would be good for stocks, because a recession means the Fed cuts rates and lower rates are good for stocks. The Fed is telling us that whether or not there’s a recession, they will continue to keep monetary policy tight (i.e., rates high) so long as inflation remains elevated.
These conflicting views create a high degree of uncertainty for investors. In this piece, we’ll seek to unpack the signals from the market and provide some context to help frame the current environment.
Current Environment
Every quarter, the Fed publishes their Dot Plot, which is a chart that summarizes the FOMC’s outlook for the Federal Funds rate. While not a perfect comparison, we can compare the most recent median Dot Plot to the current Treasury yield curve to see a visualization of the market’s expectations vs the Fed’s:
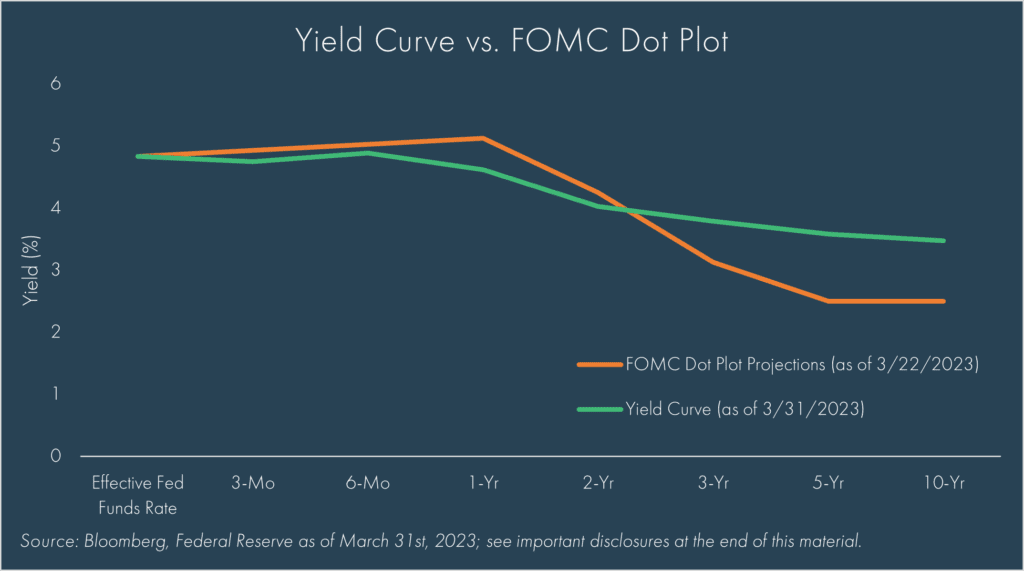
What does this curve tell us?
In a perfectly forecasted scenario, the Fed (orange line) expects the economy to slow but skirt a recession, inflation (which most recently came in at 6.0% as measured by the Headline Consumer Price Index, or CPI) moves lower, unemployment (which most recently came in at 3.6%) marginally increases, and rates slowly move back towards a long-term “neutral” level around 2.5%. This is what many market commentators refer to as a “goldilocks” or “soft-landing” scenario, and by and large, appears to be the scenario stocks are expecting, as the S&P 500 Index has risen 7.5% year-to-date through 3/31/2023.
The bond market, as reflected in the yield curve (green line), thinks differently. The steep inverted yield curve – shorter term rates higher than longer term rates – tells us the market is expecting lower rates ahead much sooner than the Fed. The expectations of lower rates so soon imply an expectation of a recession on the near-term horizon.
The yield curve has been inverted for some time. As we noted back in March of 2022 , an inverted yield curve has typically preceded a recession. However, the timing of inversion to recession varies, historically ranging from 6-36 months from inversion to the onset of a recession.
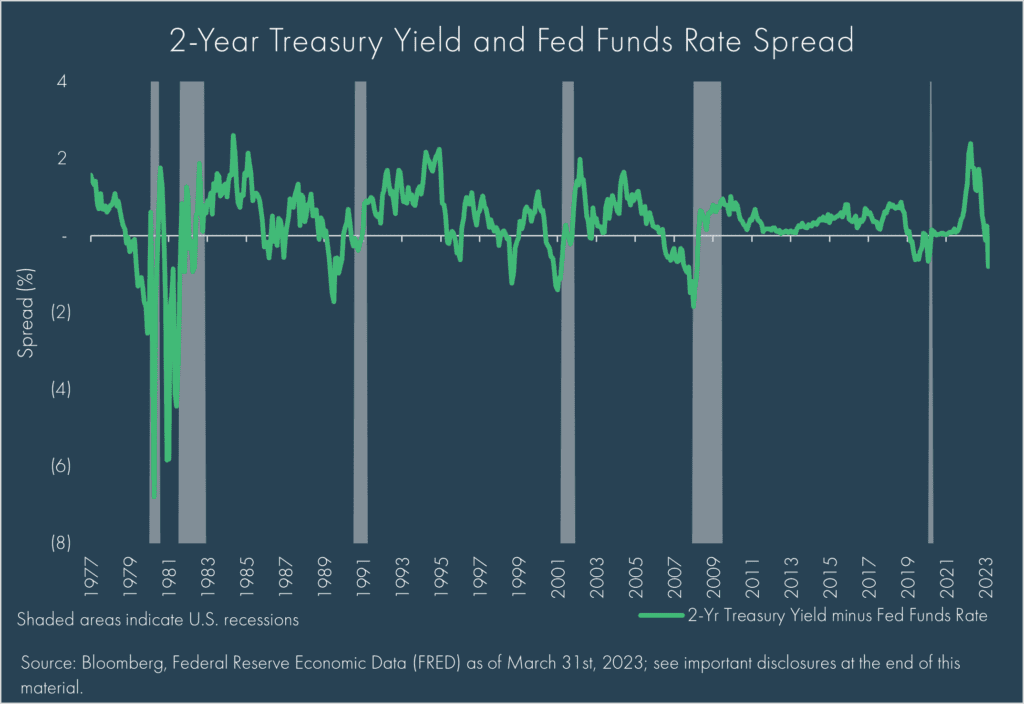
More recently, we saw the 2-Year U.S. Treasury yield drop below the Fed Funds rate, falling to its lowest level since October of 2008. Similar to the initial inversion of the curve, this decline is ringing alarm bells, due to a historical precedence of recession indication.
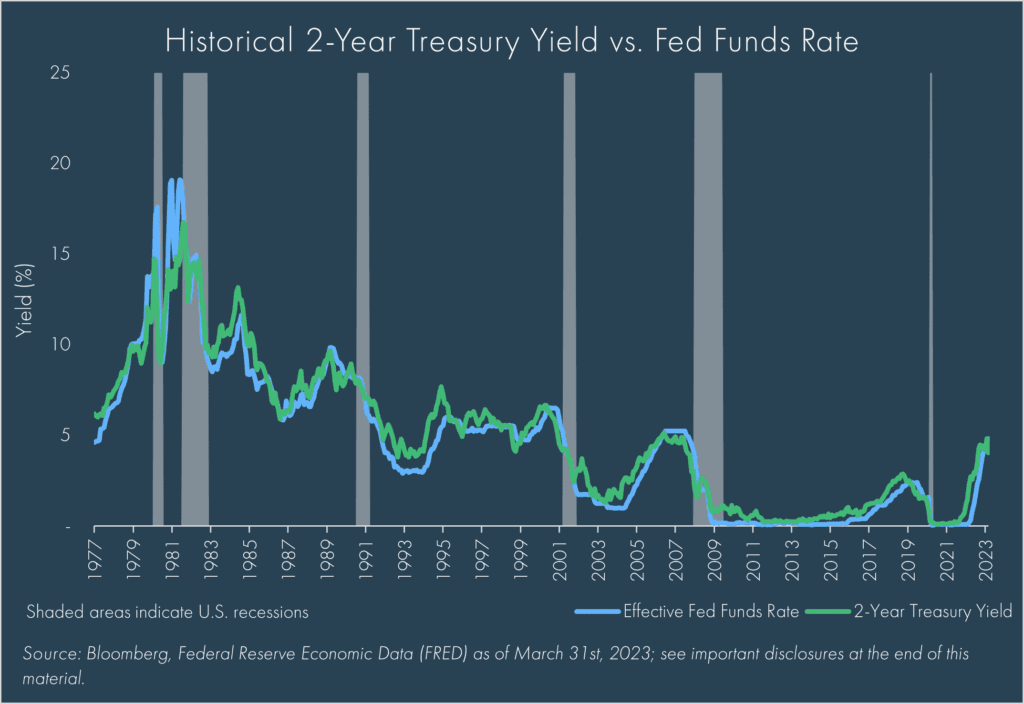
Historical Context
Historically, moves in the 2-year Treasury yields have been a good signal of the direction of the Fed Funds rate. As noted before, the current path of the yield curve indicates lower rates sooner than what the Fed expects. While investors hyper-analyze forward curves and Fed expectations, few, if any, truly believe that the Fed Funds rate can be predicted by anyone two years out; this is especially true of the Fed, who has an abysmal track record in projecting the rate path:
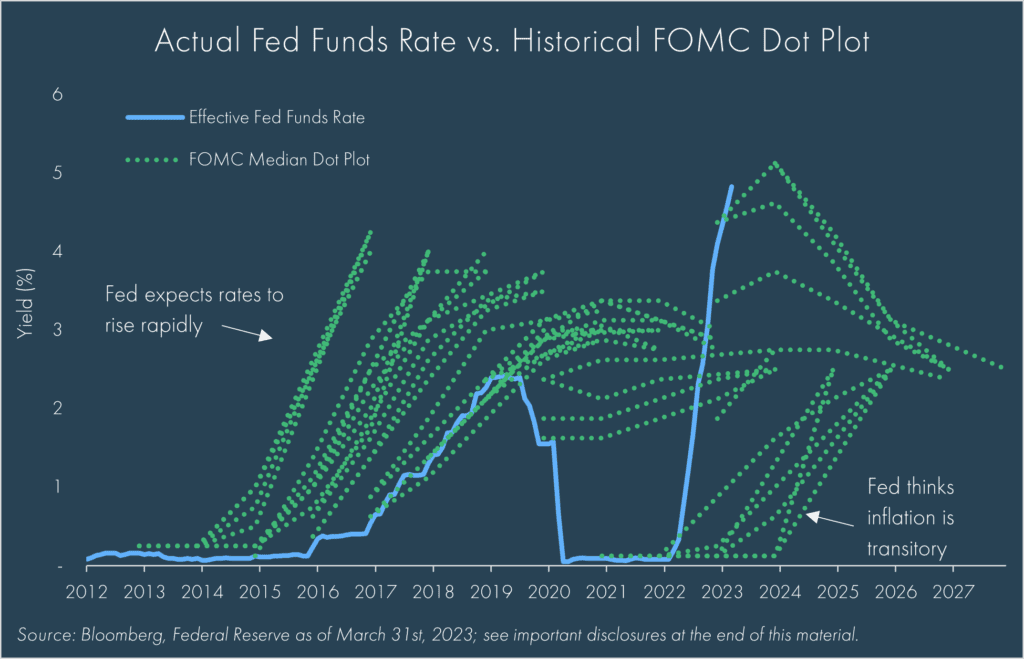
As seen in the dotted green lines, which plot the historical FOMC projected Fed Funds rate path at each meeting, versus the realized rate, the Fed repeatedly believed they would move rates higher in the early ‘10s but realized rates stayed flat given low inflation and new crises. They then thought rates would continue moving higher, but paused in late 2018 as markets dropped sharply and the financial markets seized up. Most recently, they woefully missed the recent spike in inflation, keeping monetary policy accommodative amidst what they believed was “transitory” inflation. Now, they see inflation as Public Enemy No. 1, invoking a “Volker Era”[1] mindset that aims to keep monetary policy tight even if the economy enters a recession.
Over the same period seen in the above chart, the bond market has had greater success in predicting the rate path:
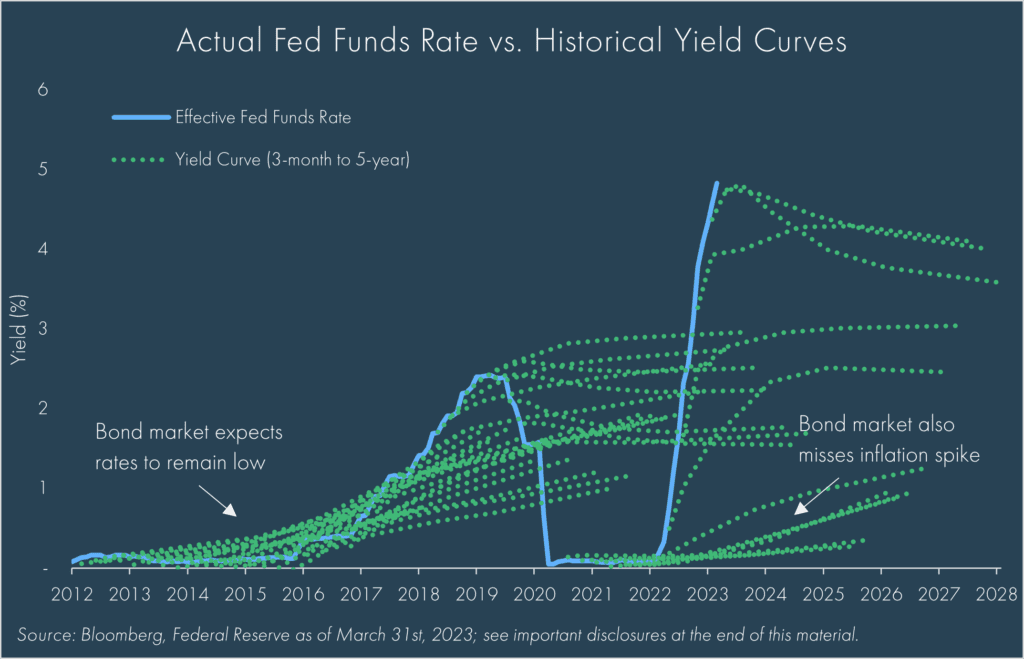
While not perfect, market yield curves have forecasted a much more realistic path of the Fed Funds rate as they rightly estimated lower rates in the early ‘10s and a lower rate path during the mid-‘10’s hiking cycle. To be sure, the bond market also missed higher inflation following the Covid Pandemic.
Applying Historical Context to Current Environment
Within these historical forecasts, we found that the 2-year Treasury yield in particular has been a fairly accurate predictor for the near-term direction of rates over the last decade. While longer term (outside of one year) forecasts are less reliable, there was notable success using a six-month projection period. Specifically, there was a 90% success rate for the current 2-year yield “predicting” the Fed Funds rate 6-months into the future within a range of +/- 50 bps (or 0.50%). This success rate dropped to 74% when projecting12-months out, and the success rate further deteriorated to 52% when projecting 2-years into the future. In other words, when we extrapolate the last decade’s success rate today, we have roughly a 50% chance that the Fed Funds rate two years from now will be within 50 bps of the 2-year Treasury yield today.
It’s important to clarify that the 2-year yield isn’t trying explicitly to predict the Fed Funds rate, but rather represents the yield investors are willing to accept for lending money to the government for the next two years (which incorporates rate expectations, inflation expectations, economic growth expectations, etc.). Nonetheless, we can loosely use this historical pattern to gain another perspective on the path of rates.
It is noteworthy that accuracy improves over the shorter lagged period, which highlights the key takeaway from this analysis: it is not so much about the level of yields as it is the direction. While the actual level may vary, both the bond market and Fed are telling us that the direction of rates is headed lower over the next few years. When this emerges is anyone’s guess; the bond market is telling us it will occur this year, while the Fed is predicting next year. They may differ on the magnitude, but both believe rates will decline due to a slowdown in economic growth, leading to disinflation.
Don’t Forget Volcker
When considering the path of rates, there is a wildcard to consider, namely, continued elevated inflation. As we’ve discussed, the 2-year Treasury yield has generally served as a good predictor of rate path direction in most periods, with the exception of the late ‘70s/early ‘80s. During this period, the bond market believed rates were going to decline, yet the Fed, led by Volcker, kept rates persistently high through money supply controls in an attempt to crush the rampant inflation, even in the midst of two recessions and heavy political pressure.
We could write an entire article on current Fed Chair Jerome Powell vs. Paul Volcker, but in short, Powell has called Volcker “the greatest economic public servant of the era.” Volcker withstood immense pressure from all angles, including protests from farmers, coffins filled with car keys from unsold vehicles by car dealers, letters from citizens who could no longer afford to purchase homes, and bi-partisan political pressure that included a threat of impeachment.[2] Powell has carefully navigated the political pressure thus far, but if the early ‘80s are any indication of what could come, then the pressure has only just begun.
The Fed expects rates to decline, but if inflation remains elevated, they are committed (currently) to maintaining higher Fed Fund rates. While the bond market does expect inflation to turn lower, the speed at which they expect rates to decline indicates an expectation that the Fed will “blink” and cut rates sooner than anticipated. Who actually “blinks” first is still up in the air.
Conclusion
The Federal Reserve has an unenviable set of choices ahead of them: (1) pause rate hikes and/or cut rates and risk losing credibility while potentially repeating the stop-and-go monetary policy of the ‘70s that ultimately led to the need for extremely tight monetary policy in the early ‘80s from Volcker, or (2) continue with their restrictive monetary policy and risk a recession in a world that has become accustomed to the Fed stepping in and saving the day. Of course, these are dire scenarios that media pundits love to posit as the only two possibilities forward. In reality, the path forward is much more complicated and nuanced.
The future is always uncertain, yet it seems even more so today as we grapple with rising geopolitical tensions, an increasingly polarized political environment, and a potential regime shift in monetary policy that has not been seen in more than 40 years. For investors, this is where the rubber meets the road. The last decade has largely made fools of anyone who bothered with a risk tolerance other than “aggressive,” as the zero-rate environment and dominance of U.S. tech helped U.S. growth stocks outperform almost every other asset class by a wide margin.
Today, there are reasonable alternatives. Real yields are higher, making fixed income more attractive; deglobalization could lead to real diversification benefits in other equity asset classes; and Moneta’s access to private markets helps give clients the ability to invest in niche asset classes that have unique growth opportunities and can potentially sidestep the daily mark-to-market volatility in public markets.
The bond market believes a recession is right around the corner and the Fed will have to cut rates. The Fed thinks they might avoid one, but either way, intend to keep rates higher for longer. Regardless of who’s right (or when they’re right), we think the next decade of investing is unlikely to look like the last. While we can never entirely avoid losses in investing, we can attempt to reduce risk via a strategically diversified portfolio that is customized for each investors’ unique needs and risk tolerance. History has shown that making short-term decisions based on fear typically leads to suboptimal decisions, which is why we seek to build strategic allocations that allow investors to breathe easier when things get tough, knowing that bumps in the road have been accounted for in their long-term financial planning.
[1] Paul Volcker was the Federal Reserve Chairman from August 6th, 1979 – August 11th, 1987
[2] Source: Federal Reserve History (https://www.federalreservehistory.org/essays/anti-inflation-measures)
DISCLOSURES
© 2023 Advisory services offered by Moneta Group Investment Advisors, LLC, (“MGIA”) an investment adviser registered with the Securities and Exchange Commission (“SEC”). MGIA is a wholly owned subsidiary of Moneta Group, LLC. Registration as an investment advisor does not imply a certain level of skill or training. The information contained herein is for informational purposes only, is not intended to be comprehensive or exclusive, and is based on materials deemed reliable, but the accuracy of which has not been verified.
Trademarks and copyrights of materials referenced herein are the property of their respective owners. Index returns reflect total return, assuming reinvestment of dividends and interest. The returns do not reflect the effect of taxes and/or fees that an investor would incur. Examples contained herein are for illustrative purposes only based on generic assumptions. Given the dynamic nature of the subject matter and the environment in which this communication was written, the information contained herein is subject to change. This is not an offer to sell or buy securities, nor does it represent any specific recommendation. You should consult with an appropriately credentialed professional before making any financial, investment, tax or legal decision. An index is an unmanaged portfolio of specified securities and does not reflect any initial or ongoing expenses nor can it be invested in directly. Past performance is not indicative of future returns. All investments are subject to a risk of loss. Diversification and strategic asset allocation do not assure profit or protect against loss in declining markets. These materials do not take into consideration your personal circumstances, financial or otherwise.
DEFINITIONS
The S&P 500 Index is a free-float capitalization-weighted index of the prices of approximately 500 large-cap common stocks actively traded in the United States.
The U.S. Treasury yield curve refers to a line chart that depicts the yields of short-term Treasury bills compared to the yields of long-term Treasury notes and bonds. The chart shows the relationship between the interest rates and the maturities of U.S. Treasury fixed-income securities. The Treasury yield curve (also referred to as the term structure of interest rates) shows yields at fixed maturities, such as one, two, three, and six months and one, two, three, five, seven, 10, 20, and 30 years. Because Treasury bills and bonds are resold daily on the secondary market, yields on the notes, bills, and bonds fluctuate.
The 2-Year Yield Treasury yield is the effective annual interest rate that the U.S. government pays on its 2-year debt obligations, expressed as a percentage. Broadly, the Treasury yield is the annual return investors can expect from holding a U.S. government security with a given maturity.
The Dot Plot is the Federal Open Market Committee (FOMC) participants’ assessments of appropriate monetary policy, summarized by the midpoint of target range or target level for the federal funds rate. Each participants’ assessment indicates the value (rounded to the nearest 1/8 percentage point) of an individual participant’s judgment of the midpoint of the appropriate target range for the federal funds rate or the appropriate target level for the federal funds rate at the end of the specified calendar year or over the longer run.
The effective Federal Funds rate (EFFR) is calculated as a volume-weighted median of overnight federal funds transactions reported in the FR 2420 Report of Selected Money Market Rates. The New York Fed publishes the EFFR for the prior business day on the New York Fed’s website at approximately 9:00 a.m. The federal funds market consists of domestic unsecured borrowings in U.S. dollars by depository institutions from other depository institutions and certain other entities, primarily government-sponsored enterprises.
The Recession time series is an interpretation of US Business Cycle Expansions and Contractions data provided by The National Bureau of Economic Research (NBER). Our time series is composed of dummy variables that represent periods of expansion and recession. The NBER identifies months and quarters of turning points without designating a date within the period that turning points occurred. The dummy variable adopts an arbitrary convention that the turning point occurred at a specific date within the period. The arbitrary convention does not reflect any judgment on this issue by the NBER’s Business Cycle Dating Committee. A value of 1 is a recessionary period, while a value of 0 is an expansionary period. For this time series, the recession begins the first day of the period following a peak and ends on the last day of the period of the trough. For more options on recession shading, see the notes and links below. Federal Reserve Bank of St. Louis, NBER based Recession Indicators for the United States from the Period following the Peak through the Trough [USREC], retrieved from FRED, Federal Reserve Bank of St. Louis; https://fred.stlouisfed.org/series/USREC, March 30, 2023.