
[button link=”https://monetastl.com/cwcj/cwcj-insider/#signup” type=”big” color=”black”] Sign-up to receive these pieces in your inbox[/button]
Advisor – Matt Schaller MBA, CFA, CFP®
In our last CWCJ Insider, we discussed economic indicators in general, as well as consumer spending and how that impacts the overall economy. Today, we will focus on a different economic indicator – employment.
Employment itself does not need much introduction – it is as simple as an employer/company agreeing to pay an employee for services rendered. However, the way that we can analyze employment to get insight into how an economy is doing or the direction it is heading is the focus of this blog.
In the United States, we typically focus on several different indicators to gauge employment – Unemployment, Labor Force Participation Rate, US Nonfarm Payrolls Month to Month, and Average Weekly hours.
Unemployment Rate
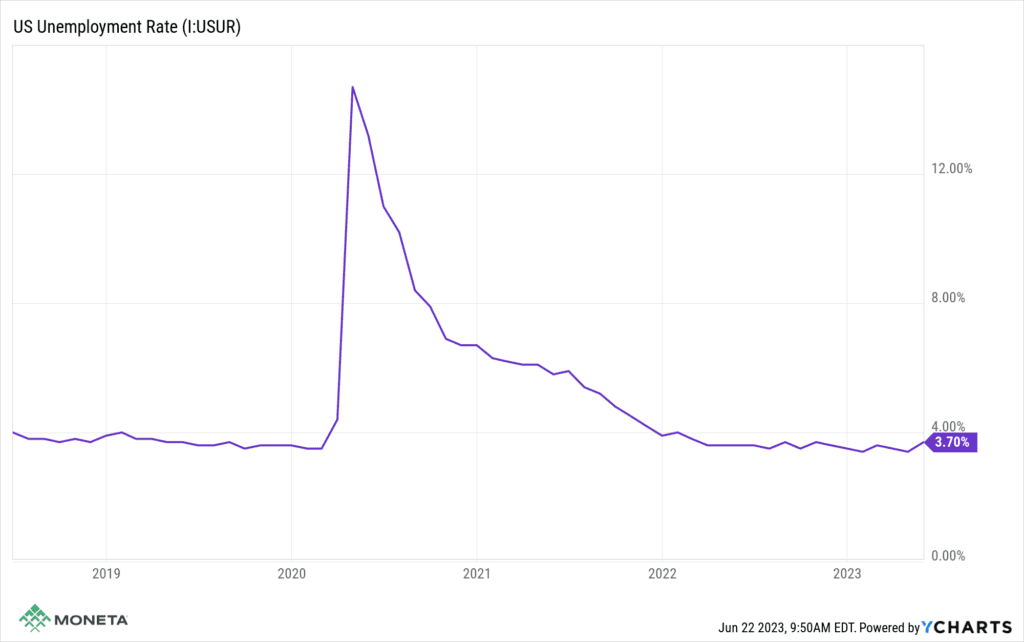
The first, and perhaps most commonly quoted in the media, is the Unemployment Rate. Someone who is unemployed is a person that is jobless, looking for a job, and is available for work. To get the Unemployment Rate, you simply divide the number of unemployed people by the total number in the labor force. The labor force is all unemployed people plus all employed people. This number is released by the Bureau of Labor Statistics each month, which they began tracking in 1948.
Typically, you will see the unemployment rate rise during harder economic times and fall in stronger economic times. The average long-term unemployment rate is 5.72%. When COVID caused mass unemployment in 2020, we saw the highest unemployment metric since tracking began, which was 14.7%. This number can be considered an anomaly due to the circumstances (and how quickly it reversed). That number excluded, the highest years of unemployment were when in 1982, unemployment hit 10.8%, and in 2009, unemployment hit 10.10%. The lowest unemployment number in history was in 1953, when we saw several months of 2.50%.
When you compare current numbers to the average, you can determine the current strength of the jobs market. However, there are a few other things to consider. Higher-than-average unemployment that is falling could be a sign that the economy is strengthening, and vice versa if you see a very low unemployment number that is increasing.
A few other “caveats” to this number to consider are Labor Force Participation Rate and Average Weekly Hours worked.
Labor Force Participation Rate
The Labor Force Participation Rate is the total labor force divided by the entire US working-age (16 years and older) population. So, for easy math, if you have 100 adults in the U.S. of working age and 55 of them are employed and 7 are unemployed, your labor force participation rate is 62%. There are many reasons why someone of working age may not be in the labor force – examples include retirees, a parent that is choosing to stay at home to raise children, students, etc. It can also include those that have simply given up looking for work. The long-term average Labor Force is 62.84%.
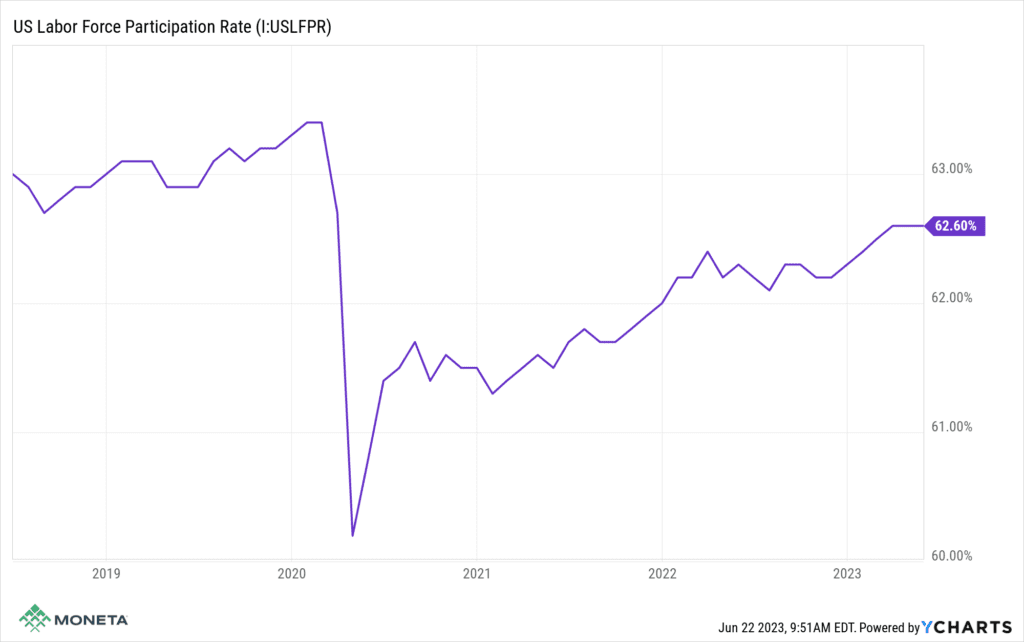
Currently, we are close to the long-term average (62.6% as of 5/31/23). However, the long-term average does include the 1950s, 1960s, and 1970s when it was typical for women to stay at home and thus not in the labor force. The Labor Force Participation Rate actually peaked in 2000 at 67.10%.
Average Hours Worked
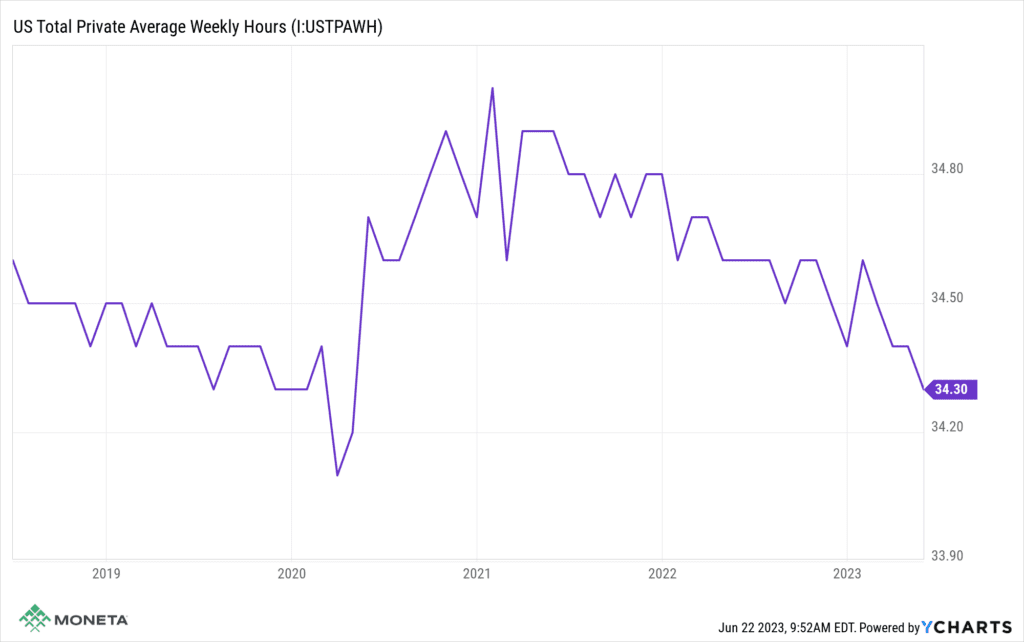
Next, if you look at average hours worked, you can gauge if a potential rise or fall in unemployment is nearing. While not always the case, many companies will resort to cutting employee hours to save cost prior to resorting to layoffs. As a result, economists will track hours worked closely, though this is less talked about in the media. If you begin to see average hours falling, it’s possible that layoffs (and higher unemployment) could be around the corner. Conversely, if you see companies increasing employee hours, they are saying there is a demand for their work, and they may be looking to hire soon (thus decreasing unemployment).
US Nonfarm Payrolls
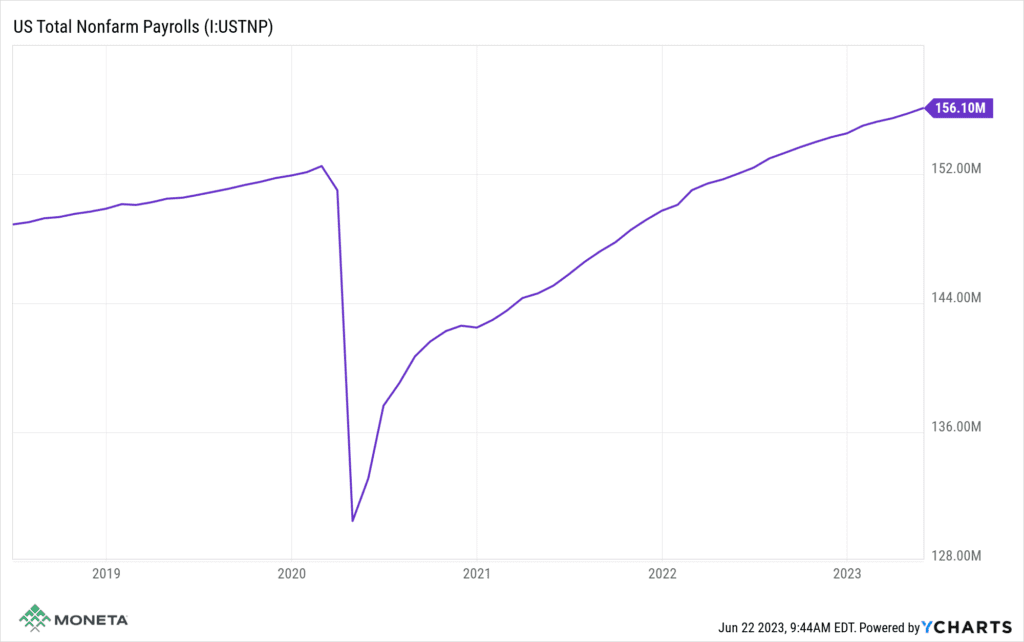
Another highly publicized statistic is the US Nonfarm Payrolls, month to month. Another report released monthly by the BLS, this metric tracks the number of jobs gained (or lost) vs. the previous month (excluding farming jobs, as the name implies). As discussed in our last CWCJ Insider, this directly correlates to U.S. consumer spending – when people are employed, they will spend money.
It is also closely watched by the Federal Reserve. It may seem like it would be a good thing if an economy is adding a large number of jobs, but there are readings that are “too hot”. If unemployment is low and a large number of jobs are being added, it could mean inflation is around the corner. When unemployment is very low but companies are adding workers (on the whole), that typically means employees are finding better jobs (most likely with higher pay). This could lead to a snowball effect – higher costs to hire means you must charge more for your product or service, but when people are getting new (higher paying) jobs, they are able to absorb the cost, thus increasing inflation further. This could cause the Fed to increase interest rates to attempt to “cool” economic growth (and thus, inflation). This is a big part of what is going on right now, we are seeing inflation remain stubbornly high as consumers are, for the most part absorbing cost increases, but that’s a topic for another day.
Analyze These Together
Understanding and analyzing employment indicators provides crucial insights into the state and trajectory of an economy. While the unemployment rate serves as a widely recognized metric, it is important to consider other factors, such as the labor force participation rate and average hours worked.
Examining these indicators together gives a more comprehensive understanding of the economy’s direction. For instance, a higher unemployment rate coupled with a higher labor force participation rate may indicate a struggling economy, but if average weekly hours and US nonfarm payrolls show positive trends, it could suggest a potential recovery from a recession. Although various other factors are at play, these employment statistics hold significant weight due to their ability to shed light on economic conditions.
By delving deeper into these indicators, we gain a clearer understanding of the intricacies of our economic landscape.
If you would like to learn more, you can contact me at 314-735-9143 or by email at mschaller@monetagroup.com.
SIGN-UP TO RECEIVE THESE EDUCATIONAL PIECES STRAIGHT TO YOUR INBOX HERE.
© 2023 Advisory services offered by Moneta Group Investment Advisors, LLC, (“MGIA”) an investment adviser registered with the Securities and Exchange Commission (“SEC”). MGIA is a wholly owned subsidiary of Moneta Group, LLC. Registration as an investment advisor does not imply a certain level of skill or training. The information contained herein is for informational purposes only, is not intended to be comprehensive or exclusive, and is based on materials deemed reliable, but the accuracy of which has not been verified. Trademarks and copyrights of materials referenced herein are the property of their respective owners. Index returns reflect total return, assuming reinvestment of dividends and interest. The returns do not reflect the effect of taxes and/or fees that an investor would incur. Examples contained herein are for illustrative purposes only based on generic assumptions. Given the dynamic nature of the subject matter and the environment in which this communication was written, the information contained herein is subject to change. This is not an offer to sell or buy securities, nor does it represent any specific recommendation. You should consult with an appropriately credentialed professional before making any financial, investment, tax or legal decision. An index is an unmanaged portfolio of specified securities and does not reflect any initial or ongoing expenses nor can it be invested in directly. Past performance is not indicative of future returns. All investments are subject to a risk of loss. Diversification and strategic asset allocation do not assure profit or protect against loss in declining markets. These materials do not take into consideration your personal circumstances, financial or otherwise.