Tim Side, CFA
“Irrational exuberance, as famously diagnosed by Robert Shiller ahead of the dot-com bust, is not the same as stupidity.”
-John Authers
Few financial metaphors come close to the use of the word “bubble”. Its simplicity and imagery are a salacious combination that generate easy clicks for media outlets. According to Bloomberg’s story count feature, an average of 300,000 news articles have included the topic “bubble” each year since 2015. It’s never far from mind, yet sometimes, it’s front and center.
Well, it would certainly seem top of mind today, with Google search interest seeing peak volume for the “AI bubble” topic alongside “sky-high valuations” and “circular spending” concerns for artificial intelligence (AI) focused companies. Add on a high-profile bankruptcy and claims that it’s a “cockroach”[1], it’s natural to wonder whether we’ve reached the end of the AI party.
Bubbles
First things first, let’s clarify what we mean by bubble. According to ChatGPT: “A financial bubble is a market phenomenon where the price of an asset (like stocks, real estate, or cryptocurrencies) rises far above its intrinsic or fundamental value, driven mainly by speculative behavior rather than underlying economic factors.” Interestingly, Webster’s Dictionary notes that a bubble is a “delusive scheme of speculation; an empty project to raise money on imaginary grounds; as the South Sea bubble”[2]. Perhaps we are arguing semantics, but it seems worth noting there is a difference between speculative behavior beyond intrinsic value and an empty project to raise money on imaginary grounds. The first implies that there is some fundamental value to be found in the underlying cause for the bubble (a “good” bubble such as railroads and computers) while the latter implies that the underlying cause is more delusional (a “bad” bubble such as tulips and meme stocks).
As our friends at Strategas note: “When we invent nice things, bubbles happen.” Chasing growth at any cost is a dangerous game, but running away from the biggest technological advances (by getting out of the market) can also have detrimental effects on one’s long-term financial goals. Keep in mind that equities are your “risky” investments for a reason. Speculative investments that can go to zero or lead to long-term growth are a part of investing. The danger arises when these investments become overly dependent on debt financing, creating risks even for your “safe” assets such as bonds.
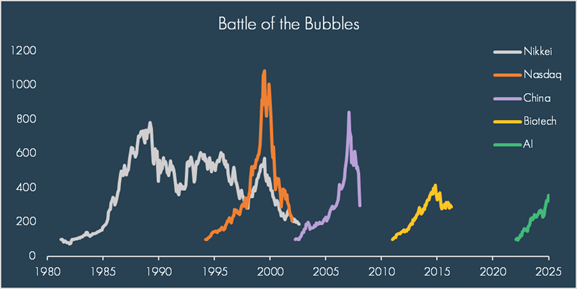
So, is there a bubble? Well, there are probably multiple bubbles of various degrees and types, but some are more concerning than others.
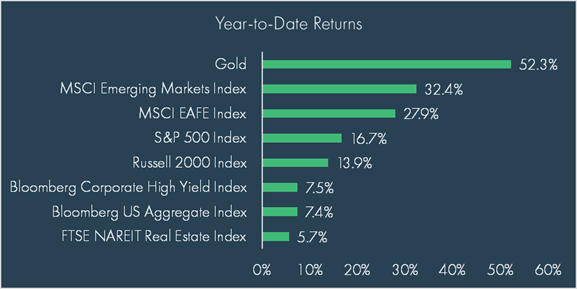
Anytime something rises this quickly, it’s worth taking a second look at the price you’re paying versus what you’re receiving. The above indexes illustrate various segments of the market that have all had fantastic performance this year, but under the hood, there are important distinctions in what you’re getting.
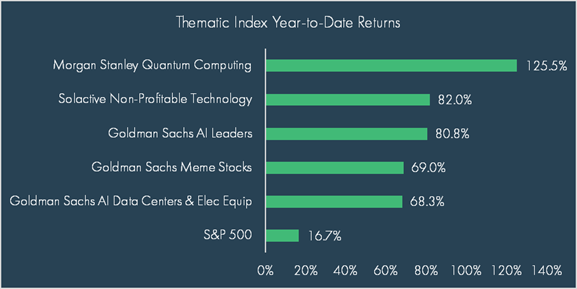
Take the S&P 500, for example. We noted in our recent quarterly update that hyperscalers (NVIDIA, Microsoft, Amazon, Meta, and Google), made up roughly 25% of the index as of September 30th. While these companies are more or less “all in” on the AI theme, their investments in AI are being funded by their profits, not debt. Similarly, with Goldman Sachs AI Leaders and AI Data Centers and Electrical Equipment Indexes, while prices may have extended above intrinsic value on the premise of exceptionally high growth, the underlying investments (Palantir, Taiwan Semiconductors, and Digital Realty, to name only a few) have real revenue and real earnings. Expensive? Yes. Empty projects? Unlikely. While much is riding on the AI theme, the risks in this “bubble” are more skewed towards a sharp correction in stock prices rather than a repeat of the 2008 global financial crisis.
However, also on the chart above, we get some déjà vu of the post-COVID days in seeing a meme stock index right up there with AI. A “meme stock” can mean many things, but a poster child for a meme stock generally looks like a struggling, heavily indebted company that retail investors pile into, driving the price significantly higher simply because the “investor” (read: “gambler”) expects someone else to pay a higher price. To be sure, this type of performance is a good sign of excess in the market, but more likely the greatest risks here are usually for the ones gambling, not the broad economy[3].
Lastly, we see quantum computing stocks at the top of the list. This type of speculative investment is probably closer to a good bubble, but it remains to be seen how this technology will play out and if it will be profitable. Similarly to the meme stocks, the amount of dollars chasing this investment is likely a sign of froth in the market, but in this case, the investments are investing in the potential for revolutionary technology, not just financially engineered speculation using leverage.
As John Authers notes in Points of Return: “The money lost by the irrationally exuberant [when the Tech Bubble burst] did not stop the internet from transforming society and the economy… …[For shareholders], a burst bubble could be really bad news. However, the fact that this bubble, like the dot-coms, has been funded primarily by equity is good news for everyone else, as the economic impact should be reduced.” Valuations matter, but it may be a more productive use of time looking for actual use cases of AI rather than trying to guess where we’re at in a potential AI bubble.
Bankruptcies
But what about First Brands? Is that the proverbial “canary in a coal mine”?[4] You can read more about the event here, but in simple terms, this company likely borrowed more money than its assets could cover, possibly pledging the same receivables to multiple lenders through various shell companies while also taking on corporate debt.
We don’t dismiss the second component (fraud), but when billions of dollars are at stake, instances of fraud are inevitable – FTX, Bernie Madoff, and Enron are prime past examples. However, this company-specific risk can be mitigated through diversification. When Enron collapsed in 2001, it was the seventh largest U.S. company. Today, the seventh largest U.S. company represents about 1.6% of the MSCI ACWI Index, or roughly 1% of a 60/40 portfolio. While the broader market would likely react negatively to such an event, bad actors using fraudulent tactics to cheat investors will always exist. For perspective, the First Brands’ $4.4 billion payment default is the fourth largest post-pandemic according to J.P. Morgan estimates.
More concerning, because it’s harder to mitigate, is the systemic risk of borrowers overextending on credit.
There are many ways to assess this risk, but we’ll simply focus on the two main components: corporations and consumers.
First, let’s look at how the market is assessing company credit risk for higher-risk corporate borrowers:
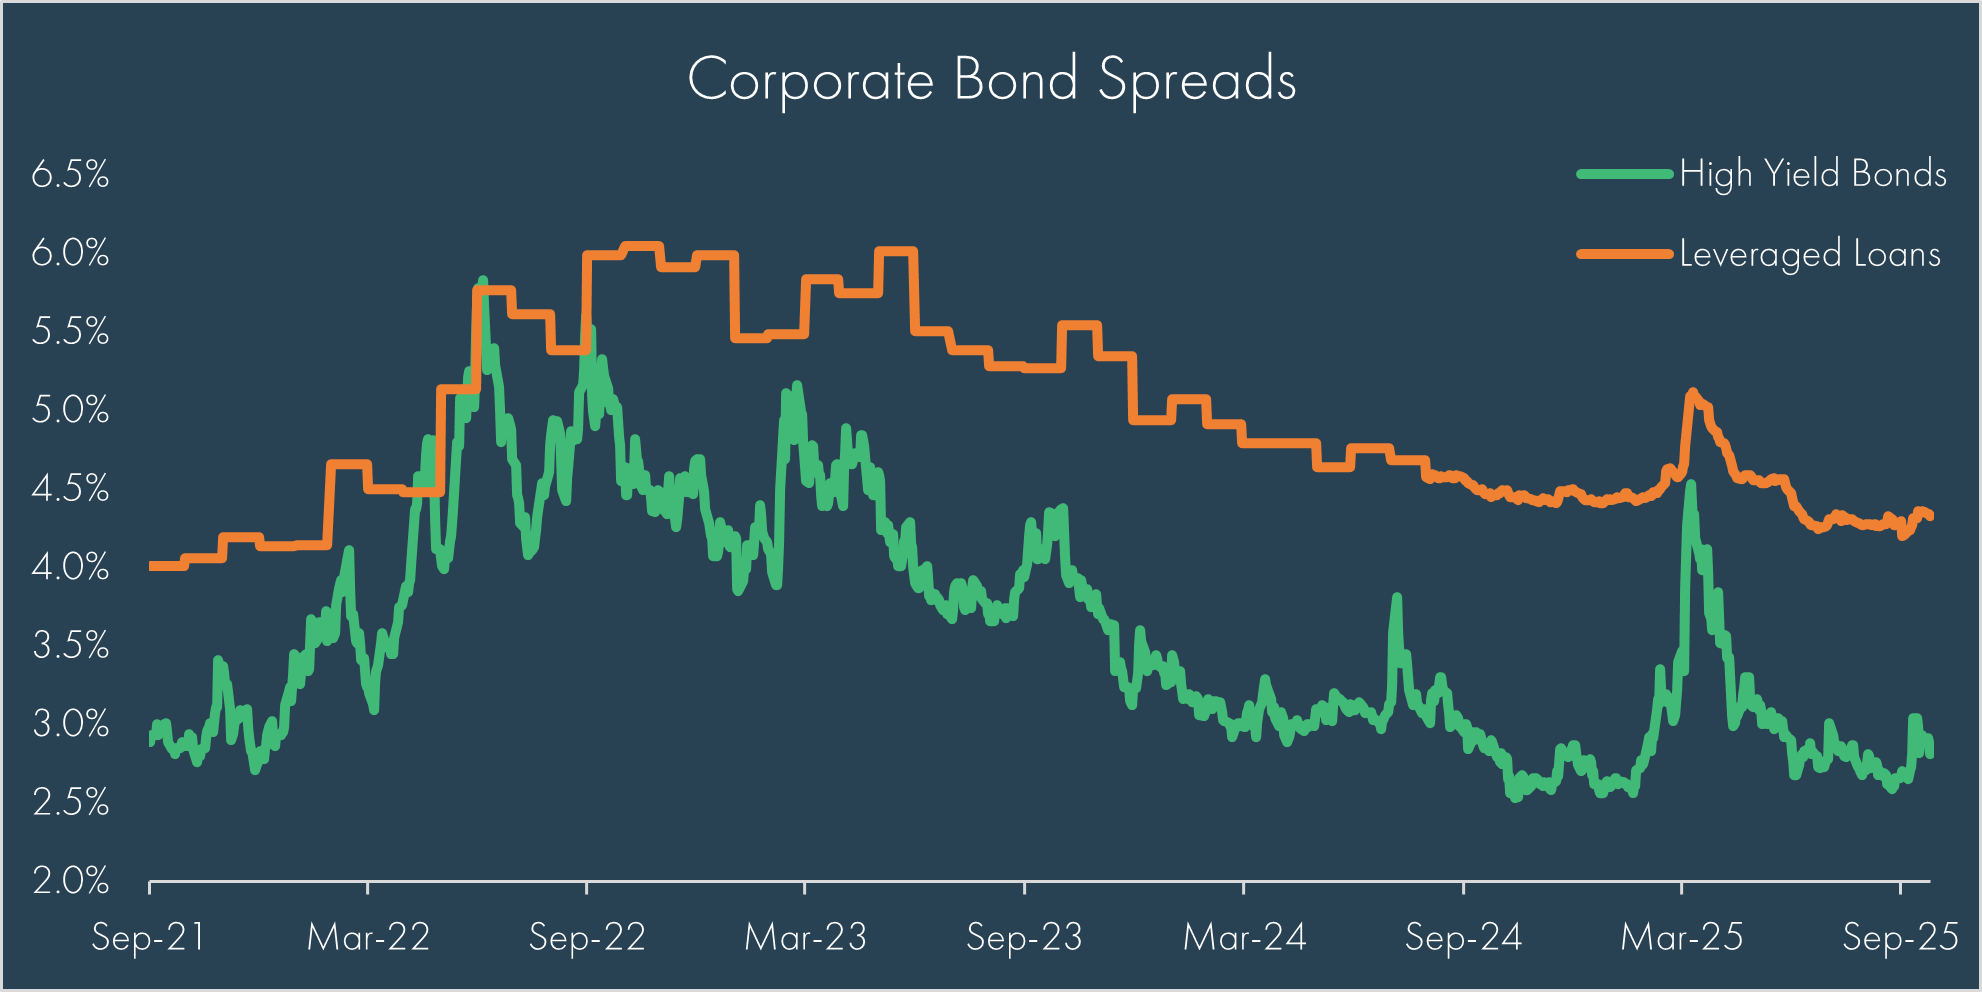
Looking at spreads (the extra yield over risk-free U.S. Treasuries) for high yield borrowers (fixed rate) and leveraged loan borrowers (floating rate), there’s been a slight uptick following the First Brands’ default, but spreads remain near historically tight levels, indicating the market is not pricing in a broader high risk of default for the market. Notably, actual default levels for high yield borrowers remain extremely low (less than 2%) while default levels for leveraged loan borrowers are somewhat elevated (around 3.5%). This is reflective of the higher interest rate environment, which put greater stress on those with floating rate loans relative to fixed rate loans – stress that is likely to subside as interest rates come down.
Next, let’s look at the consumer:
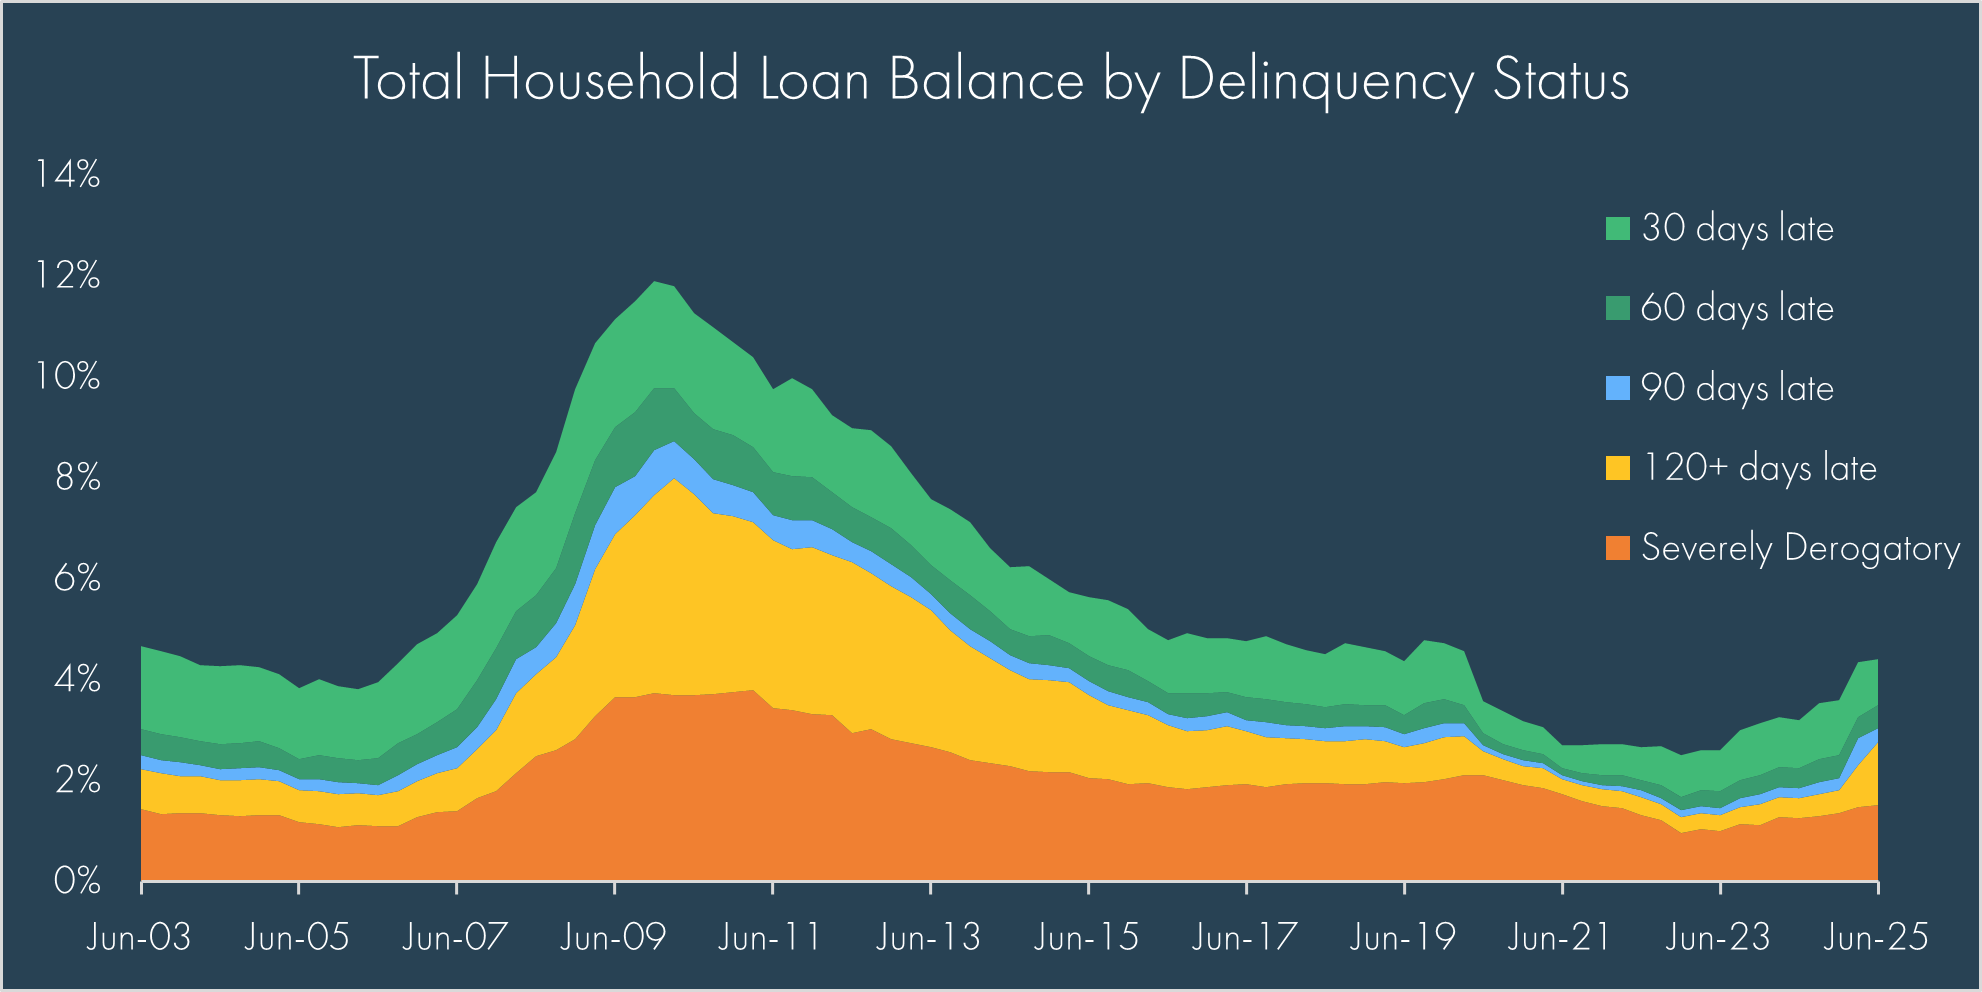
There has been a clear increase in delinquency rates for household borrowers, most noticeable in auto loans, credit cards, and student loans, with student loan delinquency rates jumping from near zero to 10% following the end of the COVID-era student loan payment moratorium. This type of data is perhaps the most challenging – there is a clear uptrend, but multiple unknown factors make it impossible to know how long this can continue.
Importantly, the absolute level is not egregious, in fact, it’s lower than it was pre-COVID, giving some comfort for the current environment. Each tick higher may be painful to watch but does not necessarily indicate an imminent recession.
Conclusion
It remains a tricky environment to invest in. Valuations are elevated and speculative investment seems to be running rampant in certain areas of the market. Politicians can’t (or won’t) keep the government open. Every day seems to bring an equal number of headlines speculating how many jobs AI will replace or how we’re in an AI bubble that’s about to pop.
Truth be told, we don’t know what inning of the “bubble” we’re in. No one does. We do know that data is sending mixed signals, so we remain skeptical of prognosticators who espouse a single view or path that the future can take – the future does not unfold in a linear fashion.
So how do we invest? Balance and discipline. Your ability to achieve your financial goals shouldn’t depend on whether the market will sell off, 5%, 10%, or even 25%. Why? Because we know it’s not a matter of if but when. Don’t bet the house on your ability to time a bubble. Stay diversified and stick to the plan.
[1] https://www.cnn.com/2025/10/16/business/jamie-dimon-us-economy-cockroaches
[2] https://webstersdictionary1828.com/Dictionary/bubble;
[3] https://papers.ssrn.com/sol3/papers.cfm?abstract_id=4874993
[4] https://en.wiktionary.org/wiki/canary_in_a_coal_mine
DISCLOSURES
© 2025 Advisory services offered by Moneta Group Investment Advisors, LLC, (“MGIA”) an investment adviser registered with the Securities and Exchange Commission (“SEC”). MGIA is a wholly owned subsidiary of Moneta Group, LLC. Registration as an investment adviser does not imply a certain level of skill or training. The information contained herein is for informational purposes only, is not intended to be comprehensive or exclusive, and is based on materials deemed reliable, but the accuracy of which has not been verified.
Trademarks and copyrights of materials referenced herein are the property of their respective owners. Index returns reflect total return, assuming reinvestment of dividends and interest. The returns do not reflect the effect of taxes and/or fees that an investor would incur. Examples contained herein are for illustrative purposes only based on generic assumptions. Given the dynamic nature of the subject matter and the environment in which this communication was written, the information contained herein is subject to change. This is not an offer to sell or buy securities, nor does it represent any specific recommendation. You should consult with an appropriately credentialed professional before making any financial, investment, tax or legal decision. An index is an unmanaged portfolio of specified securities and does not reflect any initial or ongoing expenses nor can it be invested in directly. Past performance is not indicative of future returns. All investments are subject to a risk of loss. Diversification and strategic asset allocation do not assure profit or protect against loss in declining markets. These materials do not take into consideration your personal circumstances, financial or otherwise.
DEFINITIONS
The S&P 500 Index is a free-float capitalization-weighted index of the prices of approximately 500 large-cap common stocks actively traded in the United States.
The Russell 2000® Index is an index of 2000 issues representative of the U.S. small capitalization securities market.
The MSCI EAFE Index is a free float-adjusted market capitalization index designed to measure the equity market performance of developed markets, excluding the U.S. and Canada.
The MSCI Emerging Markets Index is a float-adjusted market capitalization index that consists of indices in 21 emerging economies.
The Bloomberg U.S. Aggregate Bond Index is an index, with income reinvested, generally representative of intermediate-term government bonds, investment grade corporate debt securities and mortgage-backed securities.
The Bloomberg US Corporate High Yield Bond Index measures the USD-denominated, high yield, fixed-rate corporate bond market. Securities are classified as high yield if the middle rating of Moody’s, Fitch and S&P is Ba1/BB+/BB+ or below. Bonds from issuers with an emerging markets country of risk, based on the indices’ EM country definition, are excluded.
The FTSE Nareit All Equity REITs Index is a free-float adjusted, market capitalization-weighted index of U.S. equity REITs. Constituents of the index include all tax-qualified REITs with more than 50 percent of total assets in qualifying real estate assets other than mortgages secured by real property.
The Gold Spot price is quoted as US dollars per Troy Ounce.
The Morgan Stanley Quantum Computing Index is a thematic index tracking the performance of companies primarily focused on the development of quantum computing.
The Solactive US Non-Profitable Technology Index is an exclusively licensed index consisting of unprofitable US listed companies in innovative industries. Technology is defined broadly to include new economy companies across all sectors. The index rebalances once per month and is optimized for liquidity and concentration.
The Goldman Sachs AI Leaders Index is a basket composed of the leading companies in the AI space across semiconductor (NVDA, TSM), data centers (VRT), infrastructure (GEV), power (CEG, VST), and software (MSFT, PLTR, ORCL). The basket is equally weighted and can trade up to $1B in one at close to 10% of volume.
The Goldman Sachs Meme Stocks Index is a high retail sentiment basket consisting of US listed equities that are most popularly mentioned on retail communities. The basket is liquidity optimized but may include stocks with potential borrow constraints.
The Goldman Sachs AI Data Centers & Electrical Equipment Index is composed of hardware stocks exposed to AI and the increasing demand for data centers, across electrical industrial and infrastructure stocks, semis, data center REITs, and tech hardware. The basket can trade up to $300 million in one day with no name exceeding 10% of ADV.
The Nikkei-225 Stock Average is a price-weighted average of 225 top-rated Japanese companies listed in the First Section of the Tokyo Stock Exchange.
The NASDAQ-100 Index is a modified capitalization weighted index of the 100 largest and most active non-financial domestic and international issues listed on the NASDAQ.
The MSCI China Index is a free-float weighted equity index capturing large and mid cap representation across China A shares, B shares, Red chips, P chips, and foreign listings.
The NASDAQ Biotechnology Index is a modified market capitalization-weighted index designed to measure the performance of all NASDAQ stocks in the biotechnology sector.
The Goldman Sachs US TMT AI Index consists of companies that are pursuing artificial intelligence or can help enable new technologies across software, semiconductors, tech hardware, media, internet, and IT services. The basket is liquidity optimized to trade $500 million in a day at 10% ADV.