Executive Summary
The third quarter of 2025 extended the year’s remarkable market resilience amidst a continuing whirl of policy developments, political tension, and global uncertainty. Beneath the noise, U.S. growth remained exceptional. GDP expanded at a 3.8% annualized pace in Q2, corporate profits held firm, and productivity gains tied to ongoing AI investment helped sustain margins, though valuations across major asset classes remained elevated, leaving little margin for error as markets priced in expectations for continued good news. All told, despite headwinds, 2025 remains a story of resilience across economies, corporations, and investors.
Economic Update
Over the quarter, the Federal Reserve found itself navigating perhaps the most politically charged environment in years. Threats to Fed independence loomed large, yet the institution held its ground, cutting rates by only 25 basis points in September despite political pressure for deeper easing. The move was described as a “risk-management” cut, reflecting greater concern over the softening labor market than the potential risks of higher inflation. One new appointee, Stephen Miran, dissented in favor of a 50-bps cut, underscoring the tension inside the FOMC. While the Fed continues to stress their “data dependent view”, they have currently penciled in two more rate cuts in 2025, aligning with market expectations for a 25-bps cut at their October and December meeting.
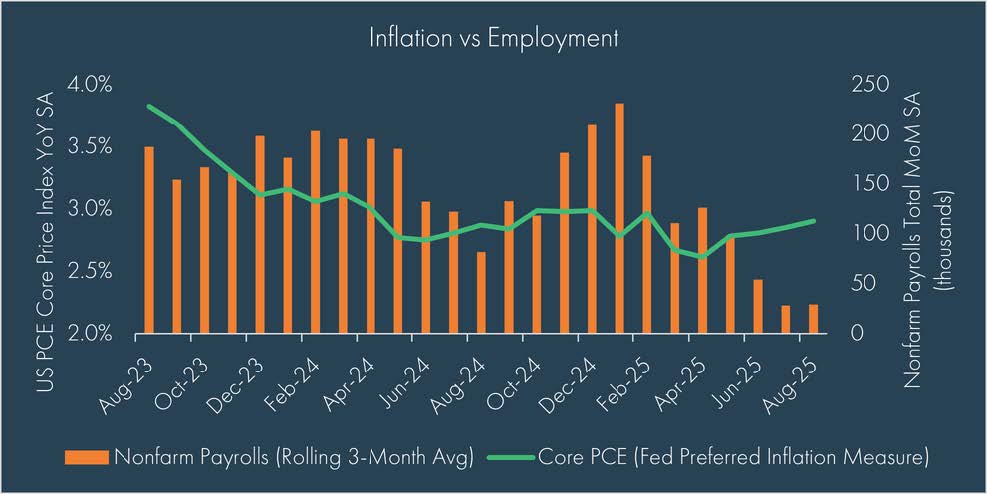
Inflation remained above target but was trending in an acceptable 2–3% range. The Fed acknowledged that fully returning to 2% may not be realistic in the near term, particularly with tariffs feeding price uncertainty. Labor data sent mixed signals: revisions pointed to slower payroll growth even as jobless claims stayed contained. As we write, primary September data is delayed due to the government shutdown, though other metrics to point to a continuation of a stalling in employment strength.
Amid the policy drama and new headlines to be added to the persistent “wall of worry”, the economy proved remarkably steady. Final Q2 GDP numbers showed that real GDP grew by an annualized 3.8% in the second quarter, supported by robust consumer spending. Additionally, moderating wage pressures likely helped preserve corporate margins while productivity gains tied to technology investment continued to boost output, reinforcing a “soft-landing” narrative.
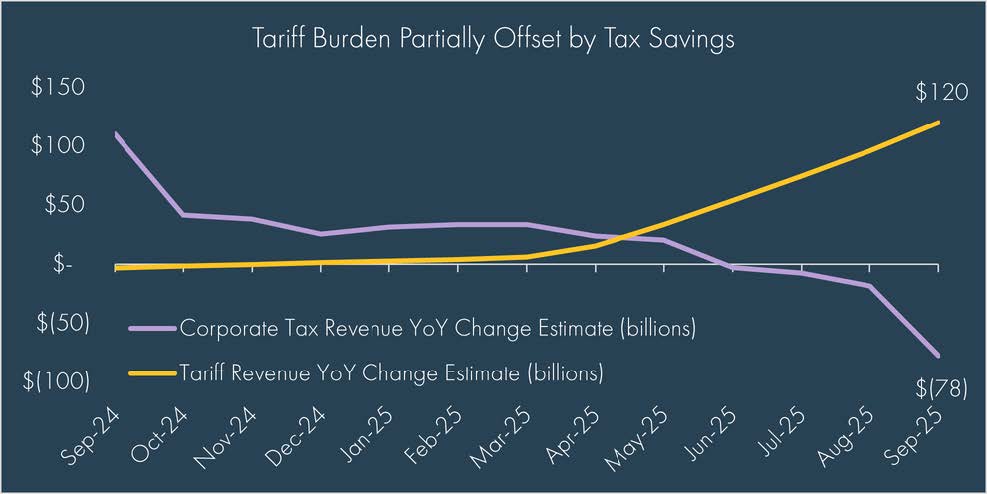
Fiscal policy also added momentum. The One Big Beautiful Bill Act (OBBB), signed into law on July 4th, extended tax cuts and introduced new incentives for businesses and households alike. Federal tax refunds for fiscal 2026 could exceed $500 billion, roughly $150 billion more than last year, potentially adding as much as half a percentage point to GDP growth if spent in 2026. Meanwhile, corporate tax receipts have already declined by an estimated $78 billion over the trailing 12-month period due to expanded tax benefits from the OBBB, partially offsetting the $120 billion increase in tariffs over the same period. While companies have been impacted differently, this dynamic gives investors some insight into how companies have been able to maintain earnings growth despite early indications that they are absorbing most of the tariff costs rather than passing along to consumers.
Geopolitically, tensions in Eastern Europe persisted. The Trump-Putin summit in August ended without progress, Russian drone incursions into NATO territory triggered two Article 4 consultations, and the “Drone Wall” concept emerged as a defensive proposal. The risk of escalation remained a background concern but did not meaningfully disrupt markets.
The quarter closed with the first government shutdown since 2019, triggered by a stalemate over Affordable Care Act tax credits. Essential services such as Social Security, Medicare, and air traffic control remain operational, though an estimated 750,000 federal employees are expected to be furloughed. The length of the shutdown remains unknown. As we write, market odds on Polymarket are favoring a longer than usual shutdown, currently assigning an almost 75% chance that the government reopens on or after October 15th. The delay in economic data releases will give investors some feelings of “flying blind”, but with the next Fed meeting set for October 29th, there remains some time until that lack of data could have a meaningful impact on economic decisions. While disruptive, markets have thus far largely looked through the noise, recognizing that prior shutdowns have historically had little long-term market impact.
Markets
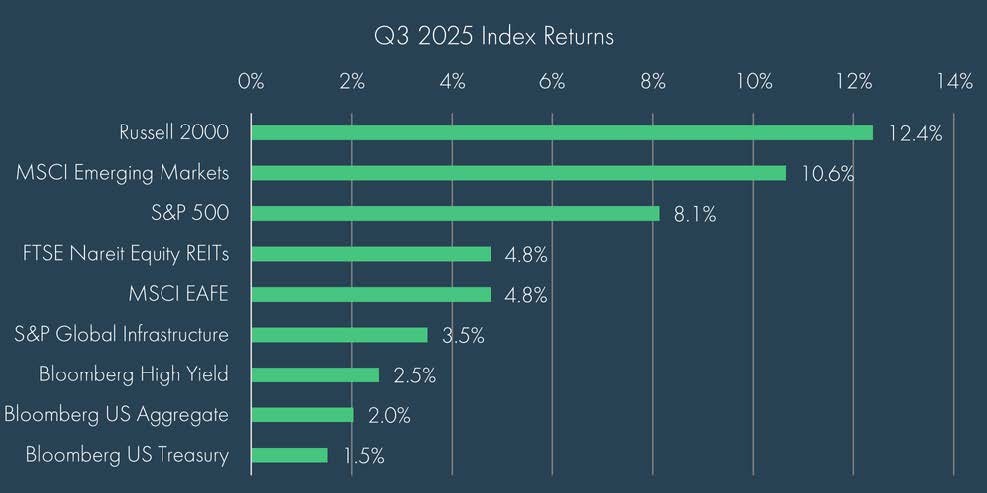
It was another strong quarter for markets, looking like a classic “risk-on” rally as equities led fixed income. Notably, we saw a broadening out in performance, with small cap stocks outperforming large cap stocks as the Fed cut rates and signaled two more cuts for the year. Non-U.S. equities continued their run of strong performance for the year, led by emerging markets, where China saw a 20% gain over the quarter and is now up more than 40% year-to-date on broad earnings upgrades and improving liquidity. Fixed income also booked solid gains as rates fell lower, and spreads continued to tighten.
Within U.S. equities, leadership broadened as small caps led the advance, benefiting from the Fed’s rate cut and easing financial conditions. Still, much of the rally was concentrated in “lower-quality” names, resulting in a so-called “junk rally” as the Russell 2000 Index has outpaced the higher-quality S&P 600 Index by more than 600 basis points year-to-date. While passive indexes often rhyme, they are not created equal as more than 40% of Russell 2000 Index constituents remain unprofitable, compared to 22% in the S&P 600 Index. Given a higher reliance on debt financing, lower rates are likely to have an outsized impact on a less profitable index such as the Russell 2000 Index.
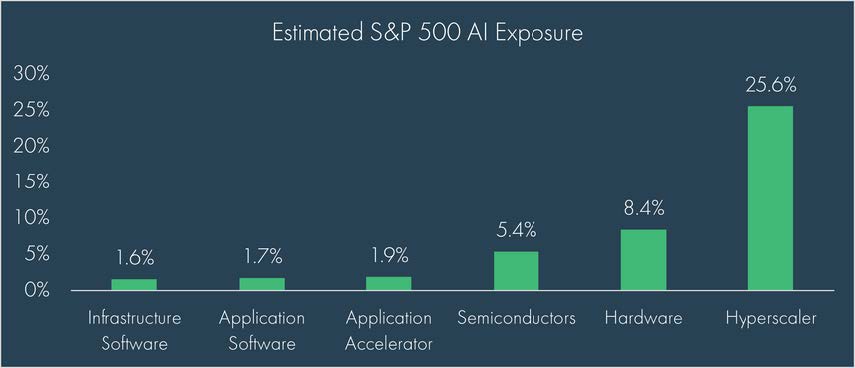
Meanwhile, the ongoing AI-driven investment cycle continued to dominate earnings and capex trends in the larger names, with five hyperscalers – NVIDIA, Microsoft, Amazon, Meta, and Google – now representing roughly 25% of the S&P 500 Index. These five companies are projected to drive nearly three-quarters of total corporate capital expenditure growth in the S&P 500 over the next three years. While these hyperscalers are extremely profitable and able to finance these expenditures from existing cash flows, the significant level of investment does create some concerns over the sustainability of the AI rally and the long-term return on the companies’ investments.
These concerns became more prominent when considering valuations, which remained a key concern over the quarter as U.S. large-cap equities sit near all-time highs across most valuation metrics. While such levels have historically implied muted long-term forward returns, elevated profit margins and robust free cash flow have, for now, justified the multiples.
Amidst the uncomfortable rally in equity markets, gold has been in a league of its own this year, up more than 47% on the year and handily outperforming the broader commodity complex, which has tracked closer to long-term averages. Gold’s strength likely reflects a mix of safe-haven demand amid rising geopolitical and policy risks, sustained central bank buying as the dollar’s global standing softens, and momentum from investors drawn to recent gains. The asset has historically provided some protection during periods of elevated inflation and market shocks; though it has also seen sustained, decade-long drawdowns, an important consideration when purchasing at record levels.
With double digit gains in some asset classes, it can be easy to forget fixed income, but it is worth noting note the supportive backdrop provided by the safe haven assets as Treasury yields declined across maturities, most notably in shorter maturities, helping normalize the curve. Both investment grade and high yield corporate spreads tightened to historically low levels, which, while stretching valuations, indicates the level of comfort bond investors have in the quality of corporate debt.
Summary
The third quarter offered investors a rare combination: strong returns, easing inflation, and declining volatility. Yet beneath the calm lies complexity. Markets are leaning heavily on continued growth, restrained inflation, and successful execution of AI-related investment – all while valuations hover at extremes.
As the Fed’s next policy meetings approach in October and December, attention will center on whether labor softness deepens and whether tariffs begin to filter more visibly into consumer prices. For now, markets expect a slow easing path, a gradual normalization of the yield curve, and continued support from fiscal stimulus.
Moneta’s investment philosophy remains unchanged. Portfolios are built for resilience, not prediction. Timing markets is dangerous, and the cost of missing just a handful of strong recovery days, as seen earlier this year, can be immense. Staying disciplined, diversified, and focused on long-term objectives remains the best course, especially when markets appear calm. Capital preservation matters more than the chase.
DISCLOSURES
© 2025 Advisory services offered by Moneta Group Investment Advisors, LLC, (“MGIA”) an investment adviser registered with the Securities and Exchange Commission (“SEC”). MGIA is a wholly owned subsidiary of Moneta Group, LLC. Registration as an investment adviser does not imply a certain level of skill or training. The information contained herein is for informational purposes only, is not intended to be comprehensive or exclusive, and is based on materials deemed reliable, but the accuracy of which has not been verified.
Trademarks and copyrights of materials referenced herein are the property of their respective owners. Index returns reflect total return, assuming reinvestment of dividends and interest. The returns do not reflect the effect of taxes and/or fees that an investor would incur. Examples contained herein are for illustrative purposes only based on generic assumptions. Given the dynamic nature of the subject matter and the environment in which this communication was written, the information contained herein is subject to change. This is not an offer to sell or buy securities, nor does it represent any specific recommendation. You should consult with an appropriately credentialed professional before making any financial, investment, tax or legal decision. An index is an unmanaged portfolio of specified securities and does not reflect any initial or ongoing expenses nor can it be invested in directly. Past performance is not indicative of future returns. All investments are subject to a risk of loss. Diversification and strategic asset allocation do not assure profit or protect against loss in declining markets. These materials do not take into consideration your personal circumstances, financial or otherwise.
DEFINITIONS
The S&P 500 Index is a free-float capitalization-weighted index of the prices of approximately 500 large-cap common stocks actively traded in the United States.
The Russell 2000® Index is an index of 2000 issues representative of the U.S. small capitalization securities market.
The MSCI EAFE Index is a free float-adjusted market capitalization index designed to measure the equity market performance of developed markets, excluding the U.S. and Canada.
The MSCI Emerging Markets Index is a float-adjusted market capitalization index that consists of indices in 21 emerging economies.
Bloomberg U.S. Treasury Bond Index includes public obligations of the US Treasury, i.e. US government bonds. Certain Treasury bills are excluded by a maturity constraint. In addition, certain special issues, such as state and local government series bonds (SLGs), as well as U.S. Treasury TIPS, are excluded.
The Bloomberg U.S. Aggregate Bond Index is an index, with income reinvested, generally representative of intermediate-term government bonds, investment grade corporate debt securities and mortgage-backed securities.
The Bloomberg US Corporate High Yield Bond Index measures the USD-denominated, high yield, fixed-rate corporate bond market. Securities are classified as high yield if the middle rating of Moody’s, Fitch and S&P is Ba1/BB+/BB+ or below. Bonds from issuers with an emerging markets country of risk, based on the indices’ EM country definition, are excluded.
The FTSE Nareit All Equity REITs Index is a free-float adjusted, market capitalization-weighted index of U.S. equity REITs. Constituents of the index include all tax-qualified REITs with more than 50 percent of total assets in qualifying real estate assets other than mortgages secured by real property.
The S&P Global Listed Infrastructure index measures the performance of global companies that are engaged in infrastructure and related operations. It provides liquid and tradable exposure to 75 companies from around the world that represent the listed infrastructure universe. To create diversified exposure, the index includes three distinct infrastructure clusters: utilities, transportation and energy.