
Introduction
Much has changed since we ended March on a dour note, with the S&P down nearly 6% that month as tariff talk ramped up and the threat of DeepSeek was high on everyone’s concerns. Early April’s Liberation Day announcement upended hopes for mild tariffs, sending recession expectations even higher. Risk assets were quick to respond and fell with speed and intensity. However, that was all to pass on the back of delays to tariff implementation, allowing for a more measured tariff approach, which helped provide a moment of clarity that served as catalyst for a robust quarter’s worth of returns.
Economic Update
For all the dire economic expectations seen at the beginning of the second quarter, as Liberation Day rattled markets, we finished the second quarter on a considerable better note. Whereas April saw elevated expectations for a recession as mass uncertainty revolved around the potential global economic outcomes, June ended with continued economic resilience which stoked the “US exceptionalism” narrative once again, though with less “gusto” than previous years.
There were multiple catalysts over the quarter for the change in sentiment and subsequent dissipation in perceived recession risks. First, Trump’s initial tariff threats were dialed back considerably alongside a 90 day implementation delay to allow for negotiations with the many nations affected. This alone allowed for a considerable uplift in market sentiment and mitigated the freefall in consumer angst as the economic outlook turned for the better, if only for the near-term. Additionally, trade deal optimism
moved higher as a deal was struck with the United Kingdom and temporary relief from respective China and US tariffs helped de-escalate trade tensions among the two largest economies.
Second, the labor market, while adding jobs at a slower pace than in 2024, has still defied expectations in the midst of a considerable amount of uncertainty for business leaders. The three months ending June 30, 2025, averaged nearly 150,000 added to payrolls per month vs the 111,000 average in the first quarter.
Third, inflation levels remained tame through May with the Consumer Price Index rising 2.4% year-over-year. Pundits still believe there is upside risk to inflation levels as tariffs are expected to shift prices higher. Given the large inventory built on tariff front-running earlier this year. May could still be too early to see notable broad-based signs of tariff-driven inflation. The Fed is keenly aware of this and has taken a wait-and-see approach on rates given the potential upside inflation risk due to tariff uncertainty.
Finally, earnings surprised to the upside for those popular companies driving technology and innovation, especially in the large equity arena. Despite the tariff uncertainty and late January concern over DeepSeek, firms like Nvidia, managed to beat expectations by a wide margin as the customer commitment to AI spending and subsequent capital expenditures on computer systems, saw continued strength. Additionally, fellow Magnificent 7 compatriot, Microsoft, announced higher-than-expected quarterly sales and profit growth as demand for cloud services remained robust despite economic concerns. Currently, estimates for S&P 500 earnings growth sit just north of 7% for the year before accelerating to 12% in 2026. Given the upheaval presented by tariffs, the 2025 estimate would be considered a welcomed outcome.

As we write, the One Big Beautiful Bill (OBBB) has been signed by President Trump, geopolitical unrest in Ukraine continues, an Israel and Iran ceasefire is still holding, and we have gone “back-to-the-future” with tariffs. For the moment, markets are taking all in stride amidst the typical slower summer market pace. As we move through the third quarter eyes will be on Treasury yields on the back of OBBB’s expansion of future deficits; how well earnings hold up to expectations; labor market’s ability to support consumer spending; and signs from inflation readings that affect Fed’s current monetary policy stance.
Markets
Quarter-end returns reflected a remarkable recovery from the April lows with the S&P 500 finishing up nearly 11%; since 1929 a quarterly return of over 10% happens only about 17% of the time. US small cap stocks, however, trailed large cap as they failed to catch the full upside when recession fears faded and remains modestly negative for the year. However, overall US equity returns were generally very healthy over the last three months.
Primary drivers of US large cap equity outperformance were the information technology and communication services sectors. These two sector performance leaders recovered sharply after the late January DeepSeek scare as their reported 1Q earnings were much better than expected, prompting a sharp recovery in valuations. The industrials sector was up meaningfully on expectations for European defense spending, easing of tariff concerns and tariff-induced purchases being brought forward.

For the rest of the world, portfolio diversification benefits continued as non-US developed and emerging markets finished up 11.8% and 12.0%, respectively, as loosened fiscal restraints, stable to improving economic data, and expectations for increased defense spending with NATO commitments helped move European stocks higher. Cheaper valuations relative to the US have been a common theme for many years but it needed a catalyst to shift them higher. Japan was a top contributor – 21% of the MSCI EAFE index’s performance – as it participated in the recovery in information technology and communication services. To be sure, a healthy dose of dollar weakening, which was down 7%, meaningfully contributed to non-US returns further this past quarter.
Listed real assets sectors’ returns diverged over the quarter with infrastructure up 10% for the quarter (and nearly 15% year-to-date) while REITs were modestly negative. The latter has remains pressured by higher long-term rates. Additionally, industrial REITS were pressured by elevated trade uncertainty and lower trade volumes while apartment REITS are facing a drop in valuations due to overcapacity in Sub Belt regions. Infrastructure has benefited from the growing infrastructure spending needs, especially for data center and AI support.
Within fixed income, which ended positive for the quarter, rate moves were uneven across the curve this quarter as the curve steepened meaningfully with the short end lower and long end higher. Spreads tightened alongside the equity rally, and sit well inside their long-term median levels. The Fed has maintained their pause in light of the uncertainty from tariffs and is in no hurry to cut. Despite this, the market currently expects 2-3 rate cuts in 2025.
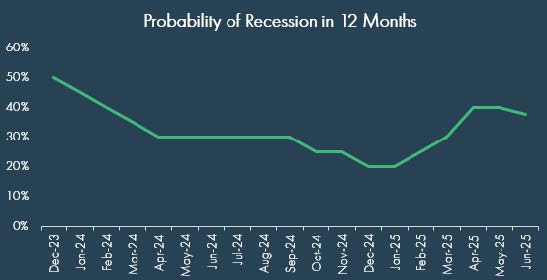
Finally, the dangers of exiting the market and missing key days could not have been more on display as it was this past quarter. As shown in the chart, bear market sentiment (in red) rose meaningfully as tariff talk and decisions commenced in earnest. The S&P 500 fell meaningfully in this period but still ended up 6.2% year-to-date as of 6/30/25. This compares to a -3.2% year-to-date return if a spooked investor had missed the 9% recovery return on April 9 . As noted before, time in the market is more important than timing the market.

Summary
As we look forward, the S&P is still on target for hitting analysts’ average expected return for 2025 of 10.6%*. Of course, all estimates, especially ones over a short period, should be taken with a grain of salt; the S&P 500 typically finishes any calendar year wide of the average analyst price target estimates. That said, investors have seen both ends of the spectrum as it relates to upside and downside this year thus far, including all-time highs and skirting with bear market levels. Drivers of bull and bear market cases abound. Bulls would argue that labor market strength will continue to support the economy; tariffs will not induce inflation levels higher as negotiations bear fruit; and earnings will continue to outperform reset expectations. However, bears would counter with an expectation of a second half economic deterioration due to tariffs; yields spiking higher on fiscal concerns and increasing inflation levels; and earnings shifting lower both in guidance and outcomes. At some point, we will receive confirmation on who is more right or more wrong, but until then, we advise clients to maintain patience and discipline in following their carefully constructed investment plans to meet long-term objectives. As seen in the second quarter, playing the timing game can be severely detrimental.
*As of 1/6/2025
DISCLOSURES
© 2025 Advisory services offered by Moneta Group Investment Advisors, LLC, (“MGIA”) an investment adviser registered with the Securities and Exchange Commission (“SEC”). MGIA is a wholly owned subsidiary of Moneta Group, LLC. Registration as an investment adviser does not imply a certain level of skill or training. The information contained herein is for informational purposes only, is not intended to be comprehensive or exclusive, and is based on materials deemed reliable, but the accuracy of which has not been verified.
Trademarks and copyrights of materials referenced herein are the property of their respective owners. Index returns reflect total return, assuming reinvestment of dividends and interest. The returns do not reflect the effect of taxes and/or fees that an investor would incur. Examples contained herein are for illustrative purposes only based on generic assumptions. Given the dynamic nature of the subject matter and the environment in which this communication was written, the information contained herein is subject to change. This is not an offer to sell or buy securities, nor does it represent any specific recommendation. You should consult with an appropriately credentialed professional before making any financial, investment, tax or legal decision. An index is an unmanaged portfolio of specified securities and does not reflect any initial or ongoing expenses nor can it be invested in directly. Past performance is not indicative of future returns. All investments are subject to a risk of loss. Diversification and strategic asset allocation do not assure profit or protect against loss in declining markets. These materials do not take into consideration your personal circumstances, financial or otherwise.
DEFINITIONS
The S&P 500 Index is a free-float capitalization-weighted index of the prices of approximately 500 large-cap common stocks actively traded in the United States.
The Russell 2000® Index is an index of 2000 issues representative of the U.S. small capitalization securities market.
The MSCI EAFE Index is a free float-adjusted market capitalization index designed to measure the equity market performance of developed markets, excluding the U.S. and Canada.
The MSCI Emerging Markets Index is a float-adjusted market capitalization index that consists of indices in 21 emerging economies.
Bloomberg U.S. Treasury Bond Index includes public obligations of the US Treasury, i.e. US government bonds. Certain Treasury bills are excluded by a maturity constraint. In addition, certain special issues, such as state and local government series bonds (SLGs), as well as U.S. Treasury TIPS, are excluded.
The Bloomberg U.S. Aggregate Bond Index is an index, with income reinvested, generally representative of intermediate-term government bonds, investment grade corporate debt securities and mortgage-backed securities.
The Bloomberg US Corporate High Yield Bond Index measures the USD-denominated, high yield, fixed-rate corporate bond market. Securities are classified as high yield if the middle rating of Moody’s, Fitch and S&P is Ba1/BB+/BB+ or below. Bonds from issuers with an emerging markets country of risk, based on the indices’ EM country definition, are excluded.
The FTSE Nareit All Equity REITs Index is a free-float adjusted, market capitalization-weighted index of U.S. equity REITs. Constituents of the index include all tax-qualified REITs with more than 50 percent of total assets in qualifying real estate assets other than mortgages secured by real property.
The S&P Global Listed Infrastructure index measures the performance of global companies that are engaged in infrastructure and related operations. It provides liquid and tradable exposure to 75 companies from around the world that represent the listed infrastructure universe. To create diversified exposure, the index includes three distinct infrastructure clusters: utilities, transportation and energy.