
What a quarter. The last three months were filled with historic events, including an incumbent dropping out of the presidential race for the first time in nearly 60 years, two failed assassination attempts on a presidential candidate (and former US President), Japan’s Nikkei 225 Index suffering its worst single day drop since 1987, the Federal Reserve cutting rates by 50 basis points, and a massive, coordinated stimulus effort announced from Chinese policy makers in an attempt to revive a deeply depressed economy. And yet, for all the volatility and consternation, it was nothing short of a fantastic quarter for just about every asset class – from stocks to bonds to real assets. In this Quarterly Report, we’ll unpack the volatile quarter and provide some thoughts for the months ahead.
Economic Update
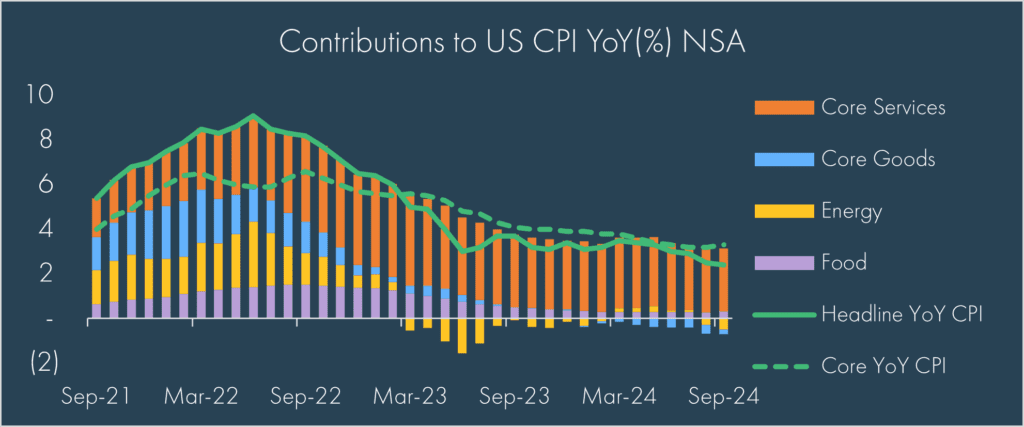
Employment and inflation are central to the Federal Reserve’s mandate of full employment and stable prices. Since the rapid rise of inflation following the COVID-19 driven supply shortages, the Fed’s primary focus has been to bring inflation back down to their long-term 2% average target. They’ve been able to do this in large part because, though weakening, employment has remained strong on an absolute basis.
In recent months, as inflation continued to move lower, albeit at a slower pace than it rose, the Fed gained confidence that “inflation is on a sustainable path back to 2 percent.”[1] Indeed, this is reflected in the data as the September CPI report highlighted a year-over-year headline inflation rate of 2.4%.
Source: Bloomberg as of October 10th, 2024; please see important disclosures at the end of this material.
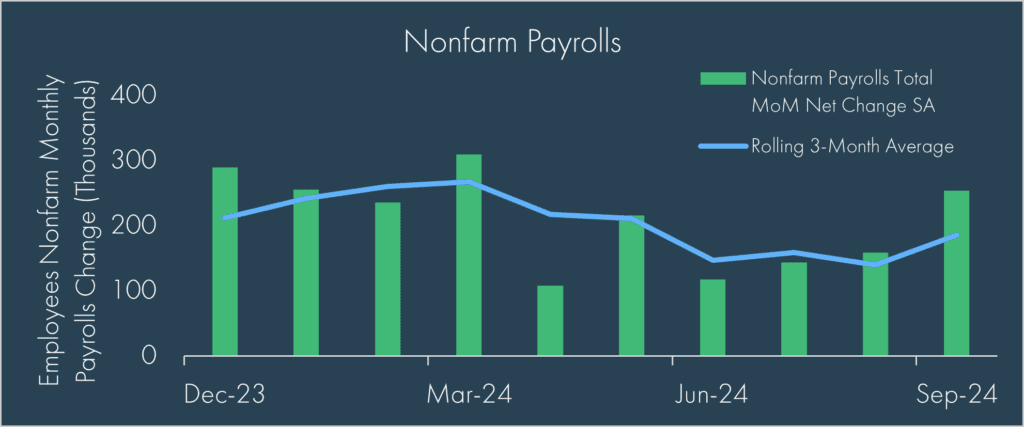
This confidence appears to have come in the nick of time, as trends in the employment data reflected declining payroll additions and an uptick in the unemployment rate. This led many to believe there was an urgent need for rates cuts as we ended August; however, a surge in September payrolls and upwardly revised Q3 data released in October eased some fears on the degree of employment data deterioration. Certainly not unusual for this year, investors have again adjusted their expectations for the number of cuts to come in the months ahead.
Source: Bloomberg as of October 4th, 2024; please see important disclosures at the end of this material.
The Fed had much to navigate throughout the quarter, buffeted by lower inflation, signs of a weaker labor market and growing belief by investors that the Fed was waiting too long to loosen monetary policy. Ultimately the Fed moved in mid-September by cutting interest rates by 0.50% (50 basis points); this did surprise some who expected a 25 basis points cut especially given the Fed acknowledging the generally healthy state of the economy. Nonetheless, the sizeable cut was received positively and provided some relief to borrowers. Additionally, global markets, where many central banks had already begun cutting rates, enjoyed relief from wide interest rate differentials which had weakened their currencies relative to the US dollar.
Outside the US, it was China in late September who stole the spotlight with a slew of stimulus measures coordinated primarily through monetary policy, including lower rates, additional lending facilities to promote stock purchases, help on homebuyer downpayments, and many more. While there was a healthy dose of skepticism from market commentators on how impactful the relief will actually be, especially without a significant thrust from fiscal stimulus, markets saw the news as a good sign. The Hang Seng Index gained 22% over the quarter, almost entirely driven in the last couple weeks of the quarter.
Looking ahead, few see a recession on the horizon for the US, though sentiment is not overly optimistic either given the broader direction of employment and still overall tight financial conditions for borrowers. Additionally, while inflation continues to show signs of improvement, the risk of a second surge in inflation seems underappreciated given historical precedence, high levels of deficit spending, deglobalization trends, and continued upward pressures on wages as seen in recent developments with the Longshoreman and Boeing strikes.
Markets
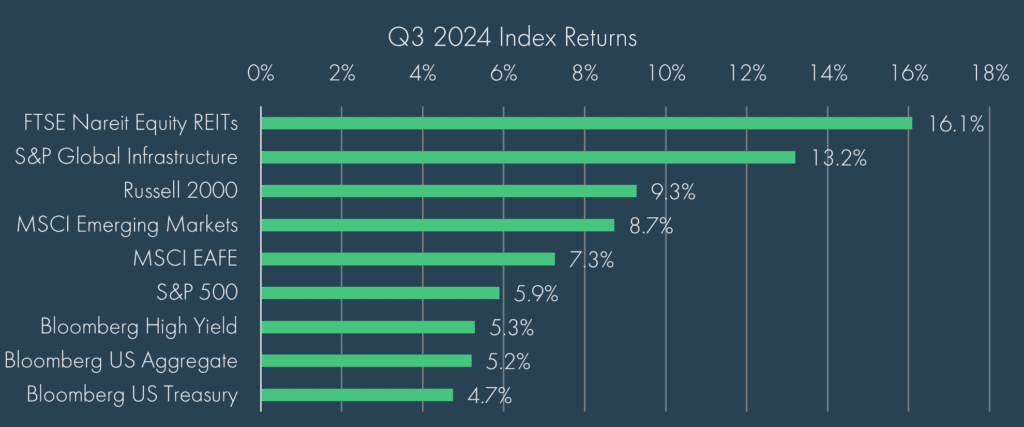
Growing confidence in the disinflation narrative and a shift to an easing interest rate outlook, all without a broad deterioration in the economy, created a perfect environment for just about every asset class to see positive returns over the quarter:
Source: Morningstar as of September 30th, 2024; please see important disclosures at the end of this material.
Perhaps the most notable thing about the quarter’s performance was the broad rotation of leadership from asset classes outside of the S&P 500, which has dominated performance charts all year long. The expectations for lower rates were the key driver behind the strong performance in Real Estate, Infrastructure, and Small Cap stocks (represented by the Russell 2000 Index above). Even within the S&P 500, there was significant broadening as the dominance of the famed Magnificent 7[2], though still magnificent, faded over the quarter. Non-US markets also saw strong tailwinds from a weaker US dollar and the stimulus measures in China noted above.
While the absolute level of returns didn’t outpace equities, bonds also had a strong month as yields fell across the curve and the Treasury yield curve un-inverted (meaning 10-year yields are once again higher than 2-year yields). Tighter spreads also benefited credit sectors, most notably in High Yield which gained more than 5% for the quarter.
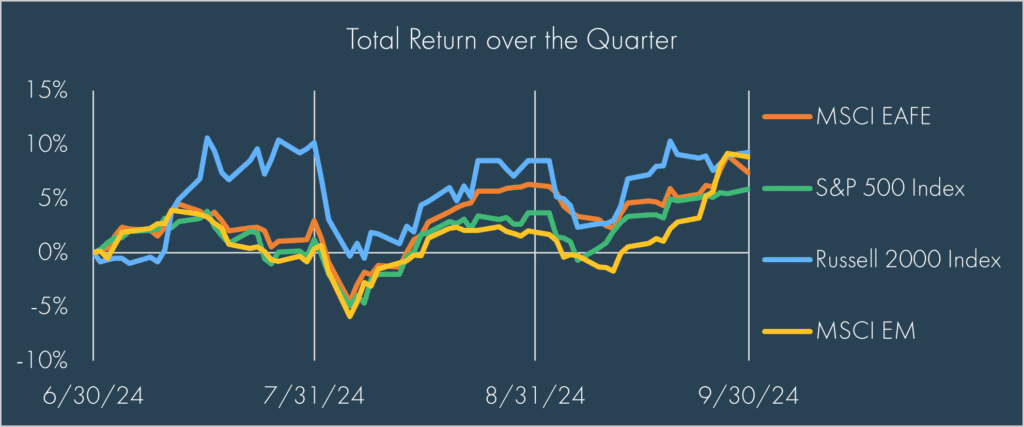
If simply looking at the quarter-end numbers, one could be forgiven for thinking it was a smooth quarter. In fact, it was anything but:
Source: Bloomberg as of September 30th, 2024; please see important disclosures at the end of this material.
Even as late as September 6th, both the S&P 500 and MSCI EM indexes were in negative territory and the Russell 2000 Index was only up 2.4% after gaining more than 10% in July. Indeed, Small Cap stocks had a particularly volatile ride as investors vacillated between an economy thought to be on the brink of a recession versus one entering a soft-landing environment.
As we look to the months ahead, it is hard to see the volatility dissipating as we approach a contentious presidential election. Historically, October is a rough month for stocks in election years and it is not uncommon to see significant swings (both up and down) in stocks on the day after the election. All signs appear to point to a tight race that could potentially be decided by just a handful of US counties.[3]
Nevertheless, the data overwhelmingly supports staying invested rather than trying to time the market based on an expected outcome depending on which candidate wins the presidency. “Obvious” trades, such as selling China stocks if Trump wins or selling Energy stocks if Harris wins, do not always pan out the way investors may think.[4] Negative outcomes are certainly possible, but over time, staying the course in a well-diversified portfolio has consistently given investors a better chance of achieving their financial goals rather than attempting to time the market.
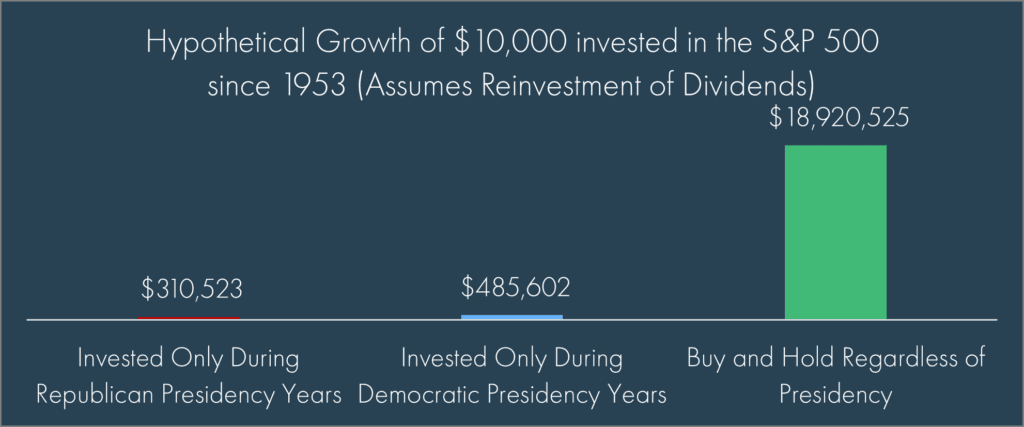
Source: Bloomberg as of September 30th, 2024. The presented performance represents hypothetical model results, as such hypothetical past performance, just like actual past performance, is no guarantee of future results. The S&P 500 index is an unmanaged portfolio of specified securities and does not reflect any initial or ongoing expenses nor can it be invested in directly. Please see important disclosures at the end of this material.
Contributors
Chris Kamykowski, CFA, CFP® – Head of Investment Strategy and Research
Tim Side, CFA – Investment Strategist
DISCLOSURES
© 2024 Advisory services offered by Moneta Group Investment Advisors, LLC, (“MGIA”) an investment adviser registered with the Securities and Exchange Commission (“SEC”). MGIA is a wholly owned subsidiary of Moneta Group, LLC. Registration as an investment adviser does not imply a certain level of skill or training. The information contained herein is for informational purposes only, is not intended to be comprehensive or exclusive, and is based on materials deemed reliable, but the accuracy of which has not been verified.
Trademarks and copyrights of materials referenced herein are the property of their respective owners. Index returns reflect total return, assuming reinvestment of dividends and interest. The returns do not reflect the effect of taxes and/or fees that an investor would incur. Examples contained herein are for illustrative purposes only based on generic assumptions. Given the dynamic nature of the subject matter and the environment in which this communication was written, the information contained herein is subject to change. This is not an offer to sell or buy securities, nor does it represent any specific recommendation. You should consult with an appropriately credentialed professional before making any financial, investment, tax or legal decision. An index is an unmanaged portfolio of specified securities and does not reflect any initial or ongoing expenses nor can it be invested in directly. Past performance is not indicative of future returns. All investments are subject to a risk of loss. Diversification and strategic asset allocation do not assure profit or protect against loss in declining markets. These materials do not take into consideration your personal circumstances, financial or otherwise.
DEFINITIONS
Consumer price index (CPI) is a measure of prices paid by consumers for a market basket of consumer goods and services. The yearly growth rates represent the inflation rate.
US Employees on Nonfarm Payrolls is derived from the Bureau of Labor Statistics (BLS). The BLS collects these data each month from the payroll records of a sample of nonagricultural business establishments. The sample includes about 140,000 businesses and government agencies representing approximately 440,000 worksites and is drawn from a sampling frame of roughly 9 million unemployment insurance tax accounts. The active sample includes approximately one-third of all nonfarm payroll employees.
The S&P 500 Index is a free-float capitalization-weighted index of the prices of approximately 500 large-cap common stocks actively traded in the United States.
The Russell 2000® Index is an index of 2000 issues representative of the U.S. small capitalization securities market.
The MSCI EAFE Index is a free float-adjusted market capitalization index designed to measure the equity market performance of developed markets, excluding the U.S. and Canada.
The MSCI Emerging Markets Index is a float-adjusted market capitalization index that consists of indices in 21 emerging economies.
Bloomberg U.S. Treasury Bond Index includes public obligations of the US Treasury, i.e. US government bonds. Certain Treasury bills are excluded by a maturity constraint. In addition, certain special issues, such as state and local government series bonds (SLGs), as well as U.S. Treasury TIPS, are excluded.
The Bloomberg U.S. Aggregate Bond Index is an index, with income reinvested, generally representative of intermediate-term government bonds, investment grade corporate debt securities and mortgage-backed securities.
The Bloomberg US Corporate High Yield Bond Index measures the USD-denominated, high yield, fixed-rate corporate bond market. Securities are classified as high yield if the middle rating of Moody’s, Fitch and S&P is Ba1/BB+/BB+ or below. Bonds from issuers with an emerging markets country of risk, based on the indices’ EM country definition, are excluded.
The FTSE Nareit All Equity REITs Index is a free-float adjusted, market capitalization-weighted index of U.S. equity REITs. Constituents of the index include all tax-qualified REITs with more than 50 percent of total assets in qualifying real estate assets other than mortgages secured by real property.
The S&P Global Listed Infrastructure index measures the performance of global companies that are engaged in infrastructure and related operations. It provides liquid and tradable exposure to 75 companies from around the world that represent the listed infrastructure universe. To create diversified exposure, the index includes three distinct infrastructure clusters: utilities, transportation and energy.
[1] https://www.federalreserve.gov/newsevents/speech/powell20240823a.htm
[2] The Magnificent 7 refers to the following seven stocks: Alphabet, Amazon, Apple, Meta, Microsoft, Nvidia, and Tesla
[3] https://apnews.com/article/election-swing-states-georgia-arizona-nevada-michigan-e69da5eb0584606ba9f02ff8fe1de9ee
[4]Despite the tariffs, the MSCI China Index outperformed the S&P 500 from during Trump’s presidency (12/31/2016–12/31/2020). Despite opposite stances on oil, the S&P 500 GICS Energy Sector lost nearly 40% during Trump’s presidency (12/31/2016-12/31/2020) while gaining more than 170% under Biden (12/31/2020-9/30/2024).