
July Observations
Onward and Upward
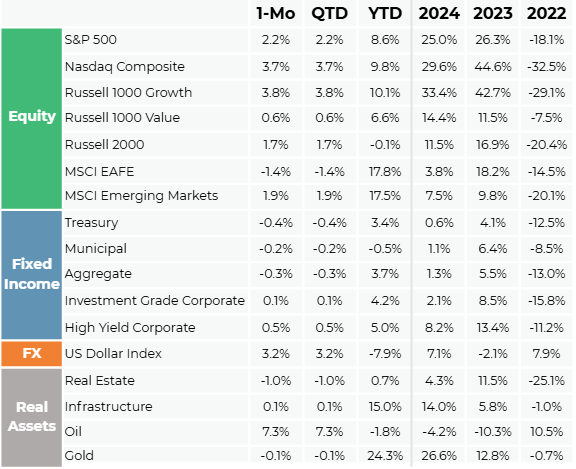
The global equity rallied continued through July, though in a reversal from the previous months, U.S. equities outperformed the rest of the world, aided by a strong U.S. dollar. Within U.S. equities, there was a return to familiar ground for investors as tech stocks led the way, with the tech-heavy Nasdaq Composite Index returning 3.7% over the month. While positive, U.S. small cap stocks lagged their large cap counterpart, as mixed economic data and tariff uncertainty drove the Federal Reserve to hold rates steady. Outside of the U.S., emerging markets gained, driven by strong returns from Vietnam (+15%), Taiwan (+6%), and China (+5%). Meanwhile, developed international markets lagged, hampered by notable currency depreciation in the Japanese yen (-5%) and the euro (-3%) against the dollar. Bonds were modestly lower as fiscal deficit and Federal Reserve independence concerns sent yields higher across the curve.
“You Get a deal!” and “You Get a “Deal”!
Markets were mostly indifferent to the deluge of tariff deals and threats announced over the month as the 90-day tariff pause approached its August 1st deadline. Ultimately, final tariff rates are likely to exceed the baseline 10% indicated on April 2nd, with notable trading partners such as the European Union seeing a 15% tariff rate, Malaysia and Indonesia facing 19% tariff rates, and India being threatened with a 25% tariff rate – to name a few. Notable exceptions exist and deals continue to be hashed out.
Economic Data: Clear as Mud
The Federal Reserve held rates steady at their July 30th meeting, noting slower growth, stable labor markets, and somewhat elevated inflation. While there were two dissenters to this vote, the decision was supported by a 3.0% GDP print for the second quarter, which saw a return of consumer spending as a key support for economic growth. That said, significant job revisions in the July jobs report (released after the meeting on August 1st) caused many to question the “stable labor markets” narrative.
Asset Manager Commentary
Private Capital Manager
Despite the escalation in geopolitics, tariff uncertainty and mixed economic data, the resilience seen in markets is no accident; it is a by-product of a potentially underappreciated global easing cycle that is still gaining traction, a technical backdrop starving of net supply and a corporate sector whose balance sheets never embraced the leverage of prior cycles.
Global Asset Manager
The recently signed OBBB Act should counteract some of the short-term effects of higher tariffs and lower immigration on economic growth, while amplifying their impact on inflation. While many spending cuts are postponed until 2027, new tax cuts for households are backdated to January 1, 2025. Since many of those cuts don’t trigger an automatic adjustment to income tax withholding schedules, early 2026 could see a bumper crop of income tax refunds.
Infrastructure Manager
Data centers are emerging as a significant new source of structural natural gas demand. Today, data centers account for approximately 4% of total U.S. natural gas demand and is expected to grow to approximately 6% by 2030.
Chart of the Month
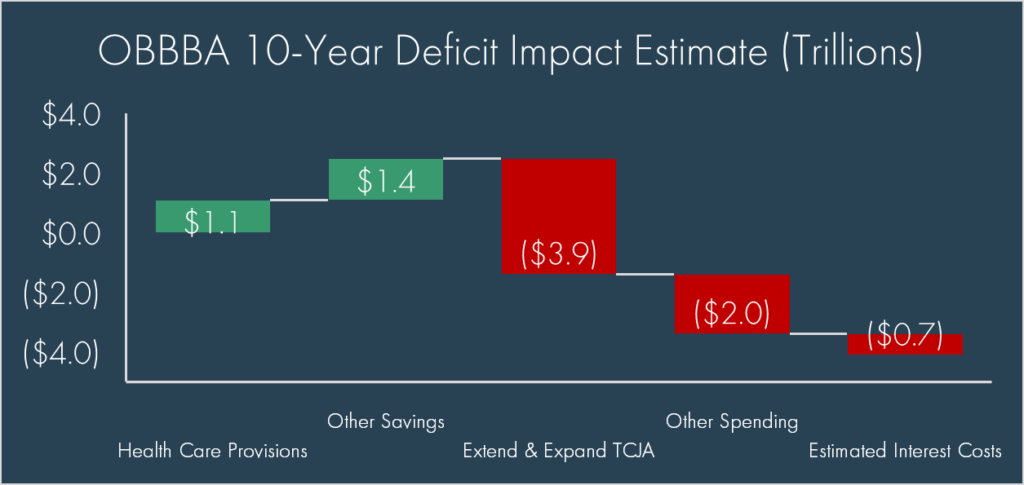
The One Big Beautiful Bill Act (OBBBA) was signed into law on July 4, 2025. The Congressional Budget Office and Committee for a Responsible Federal Budget estimate it will increase the U.S. deficit by over $4 trillion in the next decade, largely due to the extension of the expiring 2017 Tax Cuts and Jobs Act.
Sources
Morningstar Direct, Bloomberg as of 7/31/2025
Manager comments come from discussions with various asset managers and are broad commentary on sectors and not be considered recommendations by any asset manager. These comments do not necessarily reflect strategy allocations or the view or opinion of MGIA or Moneta Group .
Disclosures
© 2025 Advisory services offered by Moneta Group Investment Advisors, LLC, (“MGIA”) an investment adviser registered with the Securities and Exchange Commission (“SEC”). MGIA is a wholly owned subsidiary of Moneta Group, LLC. Registration as an investment adviser does not imply a certain level of skill or training. The information contained herein is for informational purposes only, is not intended to be comprehensive or exclusive, and is based on materials deemed reliable, but the accuracy of which has not been verified.
Trademarks and copyrights of materials referenced herein are the property of their respective owners. Index returns reflect total return, assuming reinvestment of dividends and interest. The returns do not reflect the effect of taxes and/or fees that an investor would incur. Examples contained herein are for illustrative purposes only based on generic assumptions. Given the dynamic nature of the subject matter and the environment in which this communication was written, the information contained herein is subject to change. This is not an offer to sell or buy securities, nor does it represent any specific recommendation. You should consult with an appropriately credentialed professional before making any financial, investment, tax or legal decision. An index is an unmanaged portfolio of specified securities and does not reflect any initial or ongoing expenses nor can it be invested in directly. Past performance is not indicative of future returns. All investments are subject to a risk of loss. Diversification and strategic asset allocation do not assure profit or protect against loss in declining markets. These materials do not take into consideration your personal circumstances, financial or otherwise.
Definitions
The S&P 500 Index is a free-float capitalization-weighted index of the prices of approximately 500 large-cap common stocks actively traded in the United States.
The NASDAQ Composite Index is a market capitalization weighted index with more than 3000 common equities listed on the NASDAQ Stock Market.
The NASDAQ 100 Index is a modified capitalization-weighted index of the 100 largest and most active non-financial domestic and international issues listed on the NASDAQ..
The Russell 1000® Index is an index of 1000 issues representative of the U.S. large capitalization securities market.
The Russell 1000® Growth Index measures the performance of the large-cap growth segment of the U.S. equity universe. It includes those Russell 1000 companies with higher price-to-book ratios and higher forecasted growth values.
The Russell 1000® Value Index measures the performance of those Russell 1000 Index securities with lower price-to-book ratios and lower forecasted growth values, representative of U.S. Securities exhibiting value characteristics.
The Russell 2000® Index is an index of 2000 issues representative of the U.S. small capitalization securities market.
The MSCI EAFE Index is a free float-adjusted market capitalization index designed to measure the equity market performance of developed markets, excluding the U.S. and Canada.
The MSCI Emerging Markets Index is a float-adjusted market capitalization index that consists of indices in 21 emerging economies.
Bloomberg U.S. Treasury Bond Index includes public obligations of the US Treasury, i.e. US government bonds. Certain Treasury bills are excluded by a maturity constraint. In addition, certain special issues, such as state and local government series bonds (SLGs), as well as U.S. Treasury TIPS, are excluded.
The Bloomberg U.S. Municipal Index covers the USD-denominated long-term tax exempt bond market. It includes general obligation and revenue bonds, which both can be pre-refunded years later and get reclassified as such.
The Bloomberg U.S. Aggregate Bond Index is an index, with income reinvested, generally representative of intermediate-term government bonds, investment grade corporate debt securities and mortgage-backed securities.
The Bloomberg US Corporate Bond Index measures the investment grade, fixed-rate, taxable corporate bond market. It includes USD-denominated securities publicly issued by US and non-US industrial, utility and financial issuers.
The Bloomberg US Corporate High Yield Bond Index measures the USD-denominated, high yield, fixed-rate corporate bond market. Securities are classified as high yield if the middle rating of Moody’s, Fitch and S&P is Ba1/BB+/BB+ or below. Bonds from issuers with an emerging markets country of risk, based on the indices’ EM country definition, are excluded.
The US Dollar Index measures the US dollar against six global currencies: the euro, Swiss franc, Japanese yen, Canadian dollar, British pound, and Swedish krona.
The FTSE Nareit All Equity REITs Index is a free-float adjusted, market capitalization-weighted index of U.S. equity REITs. Constituents of the index include all tax-qualified REITs with more than 50 percent of total assets in qualifying real estate assets other than mortgages secured by real property.
The S&P Global Listed Infrastructure index measures the performance of global companies that are engaged in infrastructure and related operations. It provides liquid and tradable exposure to 75 companies from around the world that represent the listed infrastructure universe. To create diversified exposure, the index includes three distinct infrastructure clusters: utilities, transportation and energy.
Brent crude is the most traded of all of the oil benchmarks, and is defined as crude mostly drilled from the North Sea oilfields: Brent, Forties, Oseberg and Ekofisk (collectively known as BFOE).
The Dow Jones Commodity Index Gold is designed to track the gold market through futures contracts.
The ICE BofA Option-Adjusted Spreads (OASs) are the calculated spreads between a computed OAS index of all bonds in a given rating category and a spot Treasury curve. An OAS index is constructed using each constituent bond’s OAS, weighted by market capitalization. The Corporate Master OAS uses an index of bonds that are considered investment grade (those rated BBB or better). When the last calendar day of the month takes place on the weekend, weekend observations will occur as a result of month ending accrued interest adjustments.
The ICE BofA Option-Adjusted Spreads (OASs) are the calculated spreads between a computed OAS index of all bonds in a given rating category and a spot Treasury curve. An OAS index is constructed using each constituent bond’s OAS, weighted by market capitalization. The ICE BofA High Yield Master II OAS uses an index of bonds that are below investment grade (those rated BB or below).
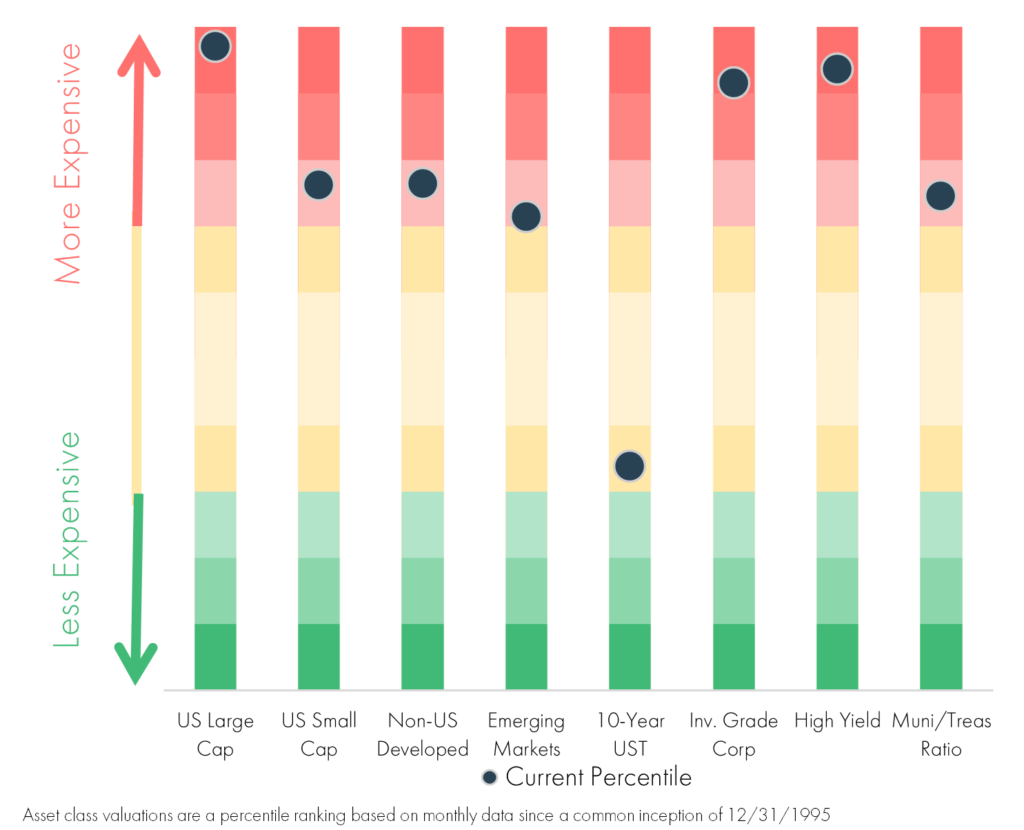
*We have updated our valuation chart data source to expand our observation period to 1995, resulting in some minor changes in the valuation estimates. Asset class valuations are a percentile ranking based on monthly data going back to common inception of 12/31/1995. The US Large Cap percentile is the average percentile ranking of the trailing P/E, P/B, P/S, and P/C ratio of the S&P 500 Index. The US Small Cap percentile is the average percentile ranking of the trailing P/E, P/B, P/S, and P/C ratio of the Russell 2000 Index. The International Developed percentile is the average percentile ranking of the trailing P/E, P/B, P/S, and P/C ratio of the MSCI EAFE Index. The Emerging Market percentile is the average percentile ranking of the trailing P/E, P/B, P/S, and P/C ratio of the MSCI Emerging Markets Index. The 10-Year US Treasury percentile is the percentile ranking of the 10-Year US Treasury yield. The Investment Grade percentile is the percentile ranking of the ICE BofA US Corporate option adjusted spread. The High Yield Corporate percentile is the percentile ranking of the ICE BofA US High Yield corporate option adjusted spread. The Municipal/Treasury percentile is the percentile ranking of the Bloomberg Municipal Index yield divided by the 10-Year US Treasury Yield.