
Chris Kamykowski, CFA, CFP® – Head of Investment Strategy and Research
Tim Side, CFA – Investment Strategist
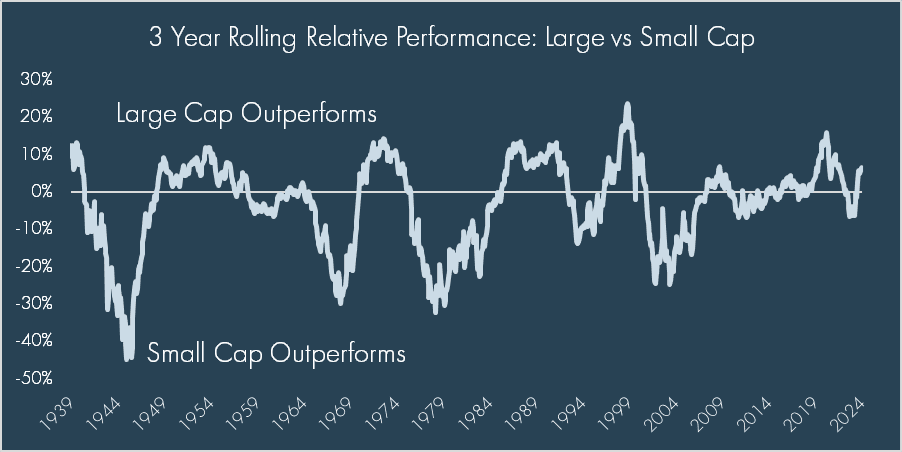
For those who believe in diversification, it has been a painful decade+ of relative returns between small cap and large cap. Since the Great Financial Crisis of 2007-2008, US large cap equities have handsomely outperformed small cap by nearly 300 bps annualized since 3/9/2009. This gap was amplified even further during the post-pandemic era as rapidly rising rates pressured valuations of small cap with inherently less capital structure flexibility and the promise of artificial intelligence (AI) sent mega cap tech stocks soaring. The magnitude of outperformance is not without good reason given the earnings differential between large cap and small cap. Valuations have reflected this too, as the Price/Earnings Ratio spread between the S&P 500 and the S&P 600[1] is at the widest level since 2001.
Today, investors reasonably wonder: can small cap regain any leadership vs large cap? History books will show that it is not unusual for small cap to experience sustained periods of outperformance. However, recent periods of small cap outperformance – such as late 2023 – have been short-lived relative to past periods where small cap had a more sustained leadership position.
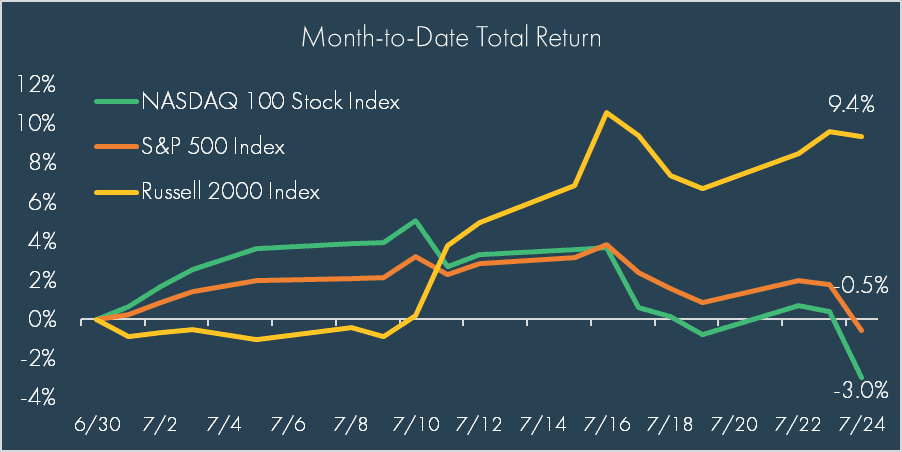
This brings us to today, which has seen a significant rotation occurring in the equity markets in July and has proven to be a godsend for small cap. The catalyst came on July 11th when the most recent Consumer Price Index inflation reading came in below expectations. This, plus cooling in the labor market, led to markets broadly signaling their expectation for a Fed rate cut in September; as recently as June 30, 2024, the probability had been priced at 56% but now stands at 100% as we write.
These factors all combined to send small cap stocks (as measured by the Russell 2000 Index) up 7.1% while the tech-oriented NASDAQ 100 Index (NASDAQ) fell 8.0% from July 11th through July 24th. In fact, on July 11th, we saw the third largest single day outperformance of the Russell 2000 Index vs the NASDAQ 100 Index (+5.8%) since the NASDAQ 100 Index’s inception in 1985.
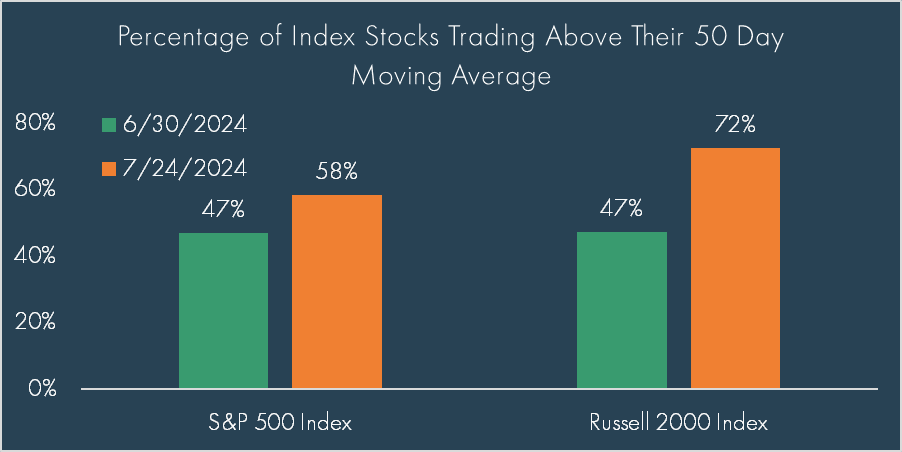
The breadth of the move has been enormous if one looks at stocks in the Russell 2000 and S&P 500 indices. While less than 50% of small cap stocks were trading above their 50-day moving average (DMA) as of the end of June, this technical statistic has moved to over 70% of the index trading above their 50DMA. While not nearly as extreme a move, the breadth of the market can also be observed in the S&P 500’s 50DMA, which went from 47% to 58% over that same time period.
To be sure, US large cap stocks remain meaningfully ahead of most markets on a year-to-date basis, and it will likely take the “Magnificent 7”[2] coming down to Earth even more to see diversification benefits continue.
What could help or hurt the momentum in small cap as we move forward? As noted above, this most recent rally was sparked by cooling inflation, so it stands to reason that short-term movements may be dependent on the path of inflation and potential Fed cuts – a surprise inflation reading to the upside (a very possible outcome) could just as easily reverse this trade. On the flipside, softer inflation readings and Fed cuts could help sustain the rally; however, it should not be forgotten that we witnessed something very similar last November, when dovish comments from Fed Chair Powell sent small cap stocks rocketing higher as markets priced in more than five rate cuts for 2024. Of course, we know how that played out in the first half of this year as market expectations reversed course sharply.
Therefore, does the recent move have legs? From a valuation perspective, small caps retain a distinct advantage as noted previously. Though large cap valuations are not at Tech-Bubble levels seen in 1999-2000, there is an aspect of “pricing to perfection” for some of the AI names. As we saw yesterday and today with Alphabet and Tesla earnings reports, any misstep by names who have driven markets higher in large cap, could send those stocks lower as analysts reset expectations of previous earnings forecasts.
Ultimately, though, there are multiple forces at play – including many not even mentioned in this piece – that make it difficult to say whether or not the rally will continue. The rest of the month will see earnings season mature and will be closely watched for any signs or hints that this market shift will continue. Economic data will be top of mind as markets assess the accuracy or overzealousness of their excitement for an expected rate cut. This is why prudent asset class diversification is important within the context of one’s portfolio – timing the market for major moves like this is difficult at best. It was only a couple weeks ago that many (including Moneta) were detailing the extreme outperformance of large cap vs small cap for the second quarter. Today, we sit in the parallel universe of small cap significantly outperforming large cap, one in which all practitioners of diversification will undoubtedly welcome and hope it is more than a fleeting moment.
[1] While the Russell 2000 is often a more commonly cited index, a lack of earnings makes valuation multiple comparisons less useful. The S&P 600 seeks to measure the small-cap segment of the US equity market with a higher quality inclusion criterion relative to the Russell 2000 Index.
[2] The Magnificent 7 refers to the following seven stocks: Alphabet, Amazon, Apple, Meta, Microsoft, Nvidia, and Tesla
DISCLOSURES
© 2024 Advisory services offered by Moneta Group Investment Advisors, LLC, (“MGIA”) an investment adviser registered with the Securities and Exchange Commission (“SEC”). MGIA is a wholly owned subsidiary of Moneta Group, LLC. Registration as an investment adviser does not imply a certain level of skill or training. The information contained herein is for informational purposes only, is not intended to be comprehensive or exclusive, and is based on materials deemed reliable, but the accuracy of which has not been verified.
Trademarks and copyrights of materials referenced herein are the property of their respective owners. Index returns reflect total return, assuming reinvestment of dividends and interest. The returns do not reflect the effect of taxes and/or fees that an investor would incur. Examples contained herein are for illustrative purposes only based on generic assumptions. Given the dynamic nature of the subject matter and the environment in which this communication was written, the information contained herein is subject to change. This is not an offer to sell or buy securities, nor does it represent any specific recommendation. You should consult with an appropriately credentialed professional before making any financial, investment, tax or legal decision. An index is an unmanaged portfolio of specified securities and does not reflect any initial or ongoing expenses nor can it be invested in directly. Past performance is not indicative of future returns. All investments are subject to a risk of loss. Diversification and strategic asset allocation do not assure profit or protect against loss in declining markets. These materials do not take into consideration your personal circumstances, financial or otherwise.
The S&P 500 Index is a free-float capitalization-weighted index of the prices of approximately 500 large-cap common stocks actively traded in the United States.
The S&P 600 Index is a capitalization-weighted index that measures the performance of selected US stocks with a small market capitalization.
The IA SBBI US Small Stock TR USD Index measures the performance of DFA U.S. Micro Cap Portfolio net of fees and expenses. The fund is designed to capture the returns and diversification benefits of a broad cross-section of U.S. small companies on a market-cap weighted basis. The fund’s target buy range includes those companies whose market capitalization falls in the lowest 5 percent of the market universe defined as the aggregate of the NYSE, NYSE Amex, and NASDAQ National Market System or companies smaller than the 1,500th largest U.S. company in the same market universe, whichever results in a higher market capitalization break.
The NASDAQ 100 Index is a modified capitalization-weighted index of the 100 largest and most active non-financial domestic and international issues listed on the NASDAQ.
The Russell 2000® Index is an index of 2000 issues representative of the U.S. small capitalization securities market.