
by John Costello, Investment Risk Analyst
*Readers unfamiliar with options terminology may wish to consult the Appendix, which provides plain-English definitions of the derivative concepts referenced throughout.
INTRODUCTION
The democratization of investments continues to make inroads into the private wealth channel with new products and solutions offered on a near constant basis. Products once reserved for institutional and the wealthiest of investors are now being made available for high net worth and in some cases, anyone with a brokerage account and a few thousand dollars. One area that has also been prominent is derivative-based funds which are changing how individual investors think about income, risk, and portfolio construction. The flood of these new products creates challenges for advisors and investors alike, given the variety of products offered and varying objectives and risks with each. Some are sophisticated risk management tools, while others are yield-chasing products wrapped up in options jargon. In this piece, we will provide some education on income-based derivative funds which appear to have become popular products for investors seeking to improve their yield.
A BIT OF HISTORY
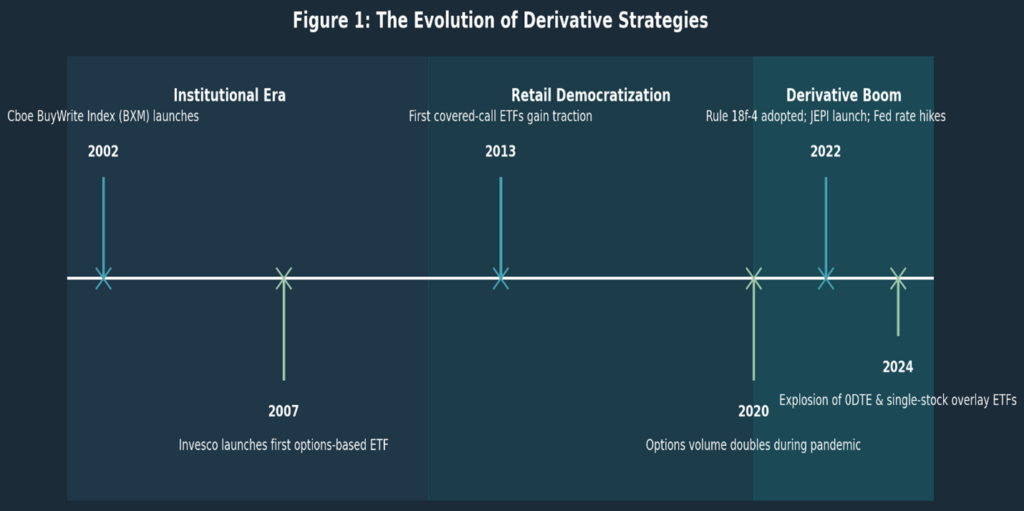
While they may be growing in popularity today, derivative-based funds are not new. The CBOE BuyWrite Index launched in 2002 to track a simple covered-call overlay on the S&P 500, but adoption remained mostly institutional until the mid-2010s, when brokerage firms moved to commission-free trading and modern platforms made options more accessible to individual investors.
Meaningful changes came in early 2020 as zero-interest-rate policies, pandemic-era trading platforms, and continuing innovations in exchange-traded funds (ETFs) converged to enable access to complex option overlays with a single trade. From there, daily options contracts on the S&P 500 more than doubled, and short-dated options became a regular part of everyday trading.
Later in 2020 the SEC adopted Rule 18f-4 (the “Derivatives Rule”) which modernized the derivatives framework for registered funds. The rule did not impact early entrants like the JPMorgan Equity Premium Income ETF (JEPI), which launched in 2020 using index options and equity-linked notes that were already permitted under prior rules. However, when Rule 18f-4 went into full effect in August 2022, it opened the door for ETF issuers to build more specialized option strategies, including single-stock option overlays, within the ETF wrapper. This paved the way for the next iteration of derivative income products. YieldMax, for example, launched its first single-stock option-income ETFs in late 2022 and quickly scaled to more than $16 billion in assets across more than 60 ETFs.
As regulations changed, market conditions further accelerated investor demand. In March 2022, the Federal Reserve began a rapid tightening cycle that lifted the Federal Funds Rate from 0.25% to 5.50% in just 16 months. While higher rates improved prospective bond yields, the speed and volatility of the adjustment produced historic drawdowns in fixed income, exposing portfolios to inherent duration risk and weakening investor confidence in bonds as a reliable income anchor. Meanwhile, persistent uncertainty around inflation, recession risk, and future rate cuts kept equity volatility elevated, contributing to higher option premiums. In that environment, investors increasingly sought “income-enhanced” strategies offering visible, frequent cash distributions. Even long-standing covered-call ETFs that had remained only niche products for years saw renewed inflows, while income-focused funds like JEPI experienced rapid asset growth.
DERIVATIVE INCOME OVERVIEW
This brings us to today where derivative-income ETFs appear to have exploded in popularity. While the lineup can look crowded from the outside, most of these funds follow one of two basic approaches to generating cash flow or yield. Understanding those approaches makes it much easier to evaluate the structure of the products, what drives the income stream, and what investors may be giving up in return.
The table below breaks down the key designs and some tradeoffs associated with each.
Figure 2: Types of Derivative-Income ETFs
| Strategy Type | How It Works | Key Tradeoff |
| Covered-Call ETFs | The fund owns a basket of stocks and sells call options on those stocks or an index to collect option premiums (the cash received for selling the contract). | Market upside is capped. If the market rises above the strike price (the level at which the option becomes exercisable), the fund gives up gains in exchange for income. |
| Single-Stock Option-Income ETFs | The fund sells options on a single stock, often using aggressive strikes to generate very high distributions. Income may include a large amount of return of capital. (distributions paid from your own principal rather than investment gains). | High income, high risk. Returns can stray far from the stock’s performance, and heavy return-of-capital payments can steadily erode the fund’s net asset value over time. |
*See important disclosures at the end of this article
Once investors understand general components of the structure, the next question is where does the “income” come from? There are two primary sources:
- Option Time Decay
- This is the steady erosion of an option’s value as it approaches expiration. Higher income comes from strikes closer to the market price but come with greater risk if prices rise quickly.
- Embedded Option Price Volatility
- This is a more pronounced source of income. Option sellers act as insurers, collecting premiums from investors willing to pay for protection against uncertainty. This premium can be measured by what’s known as the volatility risk premium (VRP)[1]. This premium can vary depending on market conditions.
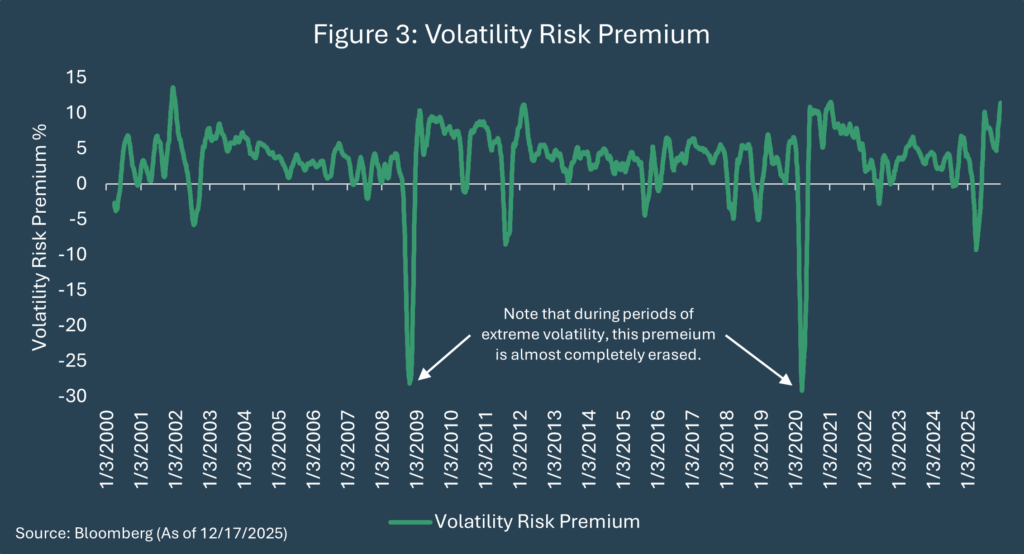
To be sure, this also underscores an important truth: the “edge” exists most of the time, not all the time. When volatility spikes (during periods like 2008 or 2020), the option seller’s accumulated premium can quickly be erased by sharp mark-to-market losses. During those periods, option-income funds are reminded of what they really are: insurance sellers, exposed to the full cost of extreme market events.
The key trade-off is not whether income is generated, but how it is generated. Option premiums do not add to equity returns; it substitutes for them. By selling options, these strategies exchange a portion of future upside for current cash flow. In modest or uneven markets, that trade-off can feel attractive. In strong equity markets, however, the same mechanics that generate income systematically limit participation in gains. This is not a flaw in the strategy, but a defining feature of how derivative income works.
NOT ALL THE INCOME IS CREATED EQUAL
One important aspect regarding the income generated is what the “income” represents. In many cases, the income comes from three different sources: Option premiums, short-term gains, and return of capital.
A product’s headline yield does not tell you which one of these sources an investor is receiving nor the breakout if there are multiple sources. A higher ”yield” may be a bit of an illusion because a large portion of the distribution can be the investor’s own principal being returned to them (return of capital) and not income yield as many investors may assume.
As an example, YieldMax’s TSLA Option Income Strategy ETF (TSLY) reported a 91.49% annualized distribution rate as of November 2025, compared to a 2.57% SEC yield. According to issuer filings, 98% of its most recent distribution was classified as return of capital rather than income. In other words, nearly all of the fund’s payout represented investors’ own principal being returned to them, not current income generated by the portfolio.[2]
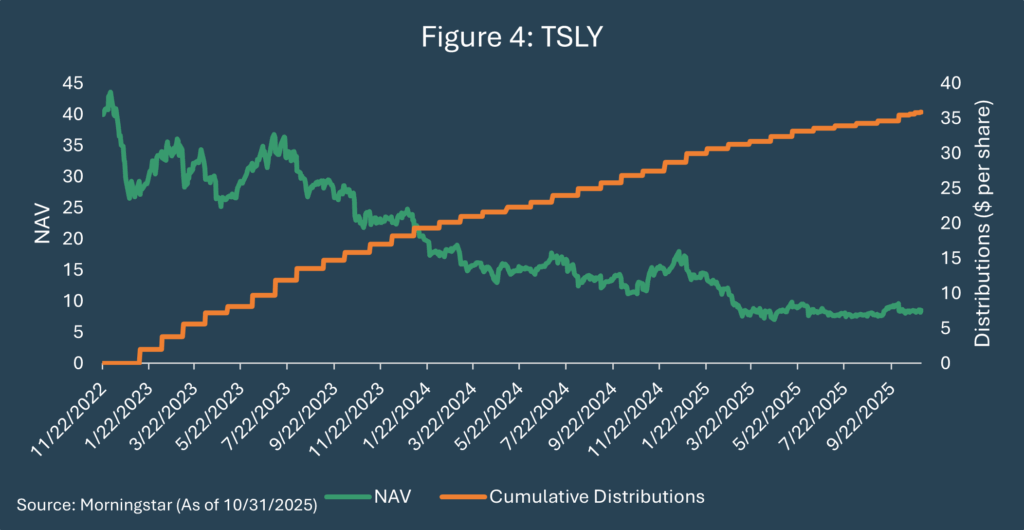
Return of capital is not inherently bad, but it can create the powerful illusion noted above regarding the “yield” of these products. Importantly, those steady monthly distributions can continue even though the fund’s net-asset-value declines as capital is returned. Returning capital in down markets can potentially lock in losses that the strategy may never fully recover from eroding the original principal invested.
WHAT ARE ADDITIONAL RISKS WITH DERIVATIVE INCOME PRODUCTS?
One risk that often gets overlooked is the underlying equity exposure itself. Derivative income strategies do not replace stock risk; they sit on top of it. The stocks used as the foundation of the strategy largely determine drawdowns, volatility, and long-term outcomes. Writing options on a diversified, lower-volatility portfolio behaves very differently than writing options on a concentrated or high-volatility stock. When upside is capped, the quality and construction of the equity exposure becomes even more important, because there is less opportunity for strong stock performance to offset losses.
Beyond the underlying equity risk, derivative income strategies are complex products that can face additional risks, including counterparty risk, tax treatment considerations, distribution timing issues, capacity constraints, and investor misperception.
- Counterparty risk arises because many of these strategies rely on third parties for options execution and clearing, which can lead to pricing dislocations and liquidity challenges during periods of market stress.
- Tax treatment varies widely depending on the derivatives used, meaning funds with similar advertised income can produce materially different after tax outcomes.
- Distribution timing presents its own risk, as derivative income ETFs continue paying cash during market downturns, reducing capital when portfolios are already under pressure and increasing sequence of returns risk.
- Capacity constraints emerge as assets crowd into volatility selling strategies, tightening option spreads and compressing premiums, which reduces the excess income these products can generate over time.
- Investor perception risk stems from steady distributions that can create a false sense of stability, leading investors to misuse the strategy or misunderstand the tradeoffs involved.
CONCLUSION
The rapid growth of derivative income products reflects a genuine investor desire for consistent cash flow in an environment where traditional income sources have disappointed. However, many of these products are more complex and more costly than they initially appear. Headline yields often obscure the true sources of distributions, embed higher tax burdens, and trade future upside for current cash flow, a trade-off that is often misunderstood when evaluating these products as sources of income. Though they can play a role, investors should approach them with clear purpose and realistic expectations about what is being exchanged for that income.
Derivative income products are tools designed for specific client situations, not necessarily universal portfolio solutions.
There could be legitimate trade-offs for investors who knowingly exchange long-term upside and simplicity for higher current cash flow. Advisors and investors should consider looking beyond the marketing hyperbole and income narratives to ensure both sides of the equation are understood: the income received today, and the return, risk, and opportunity cost given up in exchange for that income. What appears to be income is often a reshaping of return rather than a true enhancement of it.
APPENDIX 1: Derivative Concepts
| Concept | Plain-English Definition | Why It Matters for Derivative-Income Funds |
| Option | A contract giving the right—but not the obligation—to buy (call) or sell (put) an asset at a set price before expiration. | All derivative-income strategies are built from selling options to collect premiums. |
| Call Option | Right to buy at the strike price. | Covered-call ETFs sell calls to generate income but cap upside. |
| Put Option | Right to sell at the strike price. | Cash-secured put strategies collect income but take equity downside risk. |
| Premium | The price paid for an option. | For sellers, this is the “income” investors see in distribution yields. |
| Expiration | The date the option contract ends. | Shorter expirations mean faster premium decay but higher turnover and tax impact. |
| Strike Price | The predetermined buy/sell price in the option contract. | Determines how much upside is given up (calls) or downside risk is accepted (puts). |
| Assignment | When the buyer exercises the option and the seller must fulfill the obligation. | In covered calls, stock can be “called away”; in put-writes, stock may be purchased at the strike. |
| Covered Call | Own the stock + sell a call against it. | Most common yield enhancement strategy; income in exchange for capped upside. |
| Cash-Secured Put | Hold cash + sell puts obligating you to buy if the stock falls. | Similar risk to covered calls; full downside exposure. |
APPENDIX 2: Additional Risk Considerations for Derivative Income Strategies
This appendix provides brief context for the risks referenced in the main body.
Counterparty Risk: Many derivative income strategies rely on third parties for options execution and clearing, which introduces counterparty risk that traditional equity ETFs do not face. During periods of market stress, such as the volatility spike in 2020, bid ask spreads widened and options pricing became less stable. As liquidity deteriorated, some funds temporarily traded away from net asset value as derivatives became harder to price and trade efficiently.
Tax Treatment: Tax treatment varies based on the types of derivatives used within a fund. Premiums generated from covered calls on individual equities are generally taxed as short-term capital gains at ordinary income rates. Other strategies use options classified as Section 1256 contracts, which receive 60 percent long term and 40 percent short term tax treatment regardless of holding period. As a result, similarly marketed income strategies can produce materially different after-tax outcomes.
Distribution Timing: Derivative income ETFs distribute cash even during market downturns, which means capital is removed from the portfolio when it is already under pressure. Over time, this dynamic can increase sequence of returns risk by reducing the capital base available to participate in recoveries.
Capacity Constraints: The growth of derivative income strategies reflects investor demand for yield that developed during the zero-interest rate era. As assets have grown, increased competition among option sellers has tightened option spreads and compressed premiums, reducing the excess income these strategies can generate over time.
Investor Perception: The primary risk for many investors is not in the mechanics of these funds but in how they are perceived. Steady distributions can create a false sense of stability, while muted performance in strong markets can lead to frustration. In both cases, investor behavior, rather than product design, often drives poor outcomes.
[1] Because markets tend to overprice uncertainty, sellers capture what’s known as the volatility risk premium (VRP). Simply put, the VRP is the difference between the market’s expectation of future volatility (implied volatility) of a security and the subsequent realized volatility of that same security. Using Bloomberg data for the S&P 500 from 2000 through 2025, implied volatility exceeded realized volatility 73% of the time. This persistent gap highlights the market’s bias toward overestimating risk and explains why option-selling strategies can generate steady income streams.
[2] Source: https://yieldmaxetfs.com/our-etfs/tsly/
© 2026 Advisory services offered by Moneta Group Investment Advisors, LLC, (“MGIA”) an investment adviser registered with the Securities and Exchange Commission (“SEC”). MGIA is a wholly owned subsidiary of Moneta Group, LLC. Registration as an investment adviser does not imply a certain level of skill or training. The information contained herein is for informational purposes only, is not intended to be comprehensive or exclusive, and is based on materials deemed reliable, but the accuracy of which has not been verified. Trademarks and copyrights of materials referenced herein are the property of their respective owners. Index returns reflect total return, assuming reinvestment of dividends and interest. The returns do not reflect the effect of taxes and/or fees that an investor would incur. Examples contained herein are for illustrative purposes only based on generic assumptions. Given the dynamic nature of the subject matter and the environment in which this communication was written, the information contained herein is subject to change. This is not an offer to sell or buy securities, nor does it represent any specific recommendation. You should consult with an appropriately credentialed professional before making any financial, investment, tax or legal decision. An index is an unmanaged portfolio of specified securities and does not reflect any initial or ongoing expenses nor can it be invested in directly. Past performance is not indicative of future returns. All investments are subject to a risk of loss. Diversification and strategic asset allocation do not assure profit or protect against loss in declining markets. These materials do not take into consideration your personal circumstances, financial or otherwise.