Chris Kamykowski, CFA, CFP® – Head of Investment Strategy and Research
Tim Side, CFA – Investment Strategist
“I fear no man. But that thing, it scares me.”[1]
Ever since the compromise between Alexander Hamilton, Thomas Jefferson and James Madison in 1790, which allowed for the US Treasury to assume and consolidate state debt in exchange for a national capital move to what is now Washington D.C., debt has been an integral part of the U.S. experiment. At that time, the estimated total public debt was a paltry $77 million[2]. Today, that debt has grown into something of a bipartisan monstrosity, exceeding $35 trillion and ever growing as the U.S. federal government is currently running an annual budget deficit that exceeds $1 trillion.
Concerns over debt levels are nothing new – over the last 10 years, Bloomberg’s story count feature averages more than 1,100 news stories a month including the words “debt-to-GDP” – but increased fiscal spending combined with higher interest rates, have kept the budget challenges at the front of many investors’ minds.
As we have said before, there are no easy solutions and we do not pretend to have the answer that solves all ills. For practical reasons, we will leave that to our elected officials, rightly or wrongly.
However, as investors, we cannot ignore the U.S. Treasury market, a mainstay asset in portfolios providing income and a hedge to risk-assets elsewhere in the portfolio. Not only do Treasury and other government related bonds make up 48%[3] of the Bloomberg Aggregate Bond Index (a measure of all publicly traded debt in the U.S.), but Treasury bonds are often used as the risk-free rate for financial assets, a critical component underpinning asset valuations.
In this piece, we will examine the dynamics of U.S.’s debt and deficits and provide some insights on the potential investment implications.
Current Dynamics: “Houston, we have a problem.”
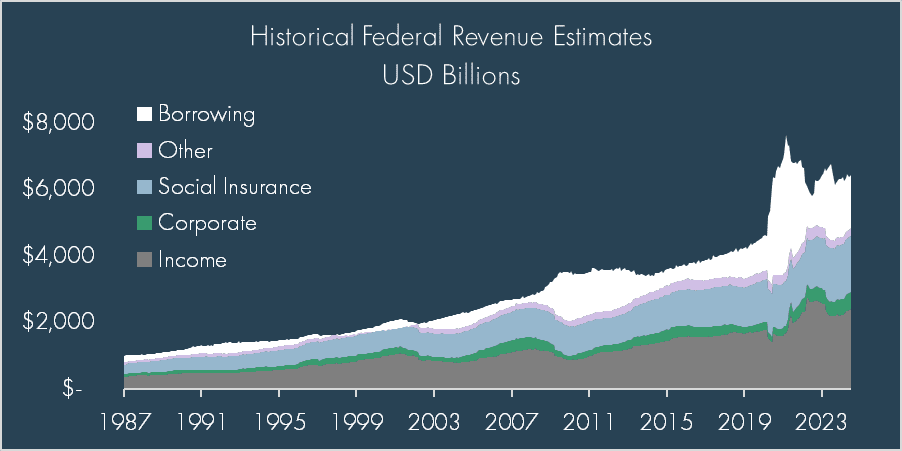
From almost every angle, the current U.S. debt and deficit levels are concerning. There are, of course, exceptions that we’ll discuss later on, but there is no getting around the historically high levels of debt-to-GDP, deficit spending, and interest costs as illustrated in the charts below:
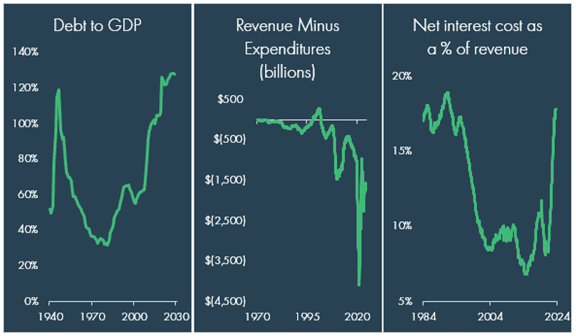
Source: Bloomberg as of 7/31/2024; Please see important disclosures at the end of this material.
Items to note are:
- Calendar year estimates by the White House’s Office of Management and Budget show an estimated debt-to-GDP level of 124% at the end of 2024, rising to 128% by the end of 2029. This level is higher than the WWII era.
- As of July 31st, the trailing 12-month fiscal deficit estimate was $1.6 trillion.
- As of July 31st, the net interest expense estimate was nearly 18% of revenue ($861 billion) over the last 12 months.
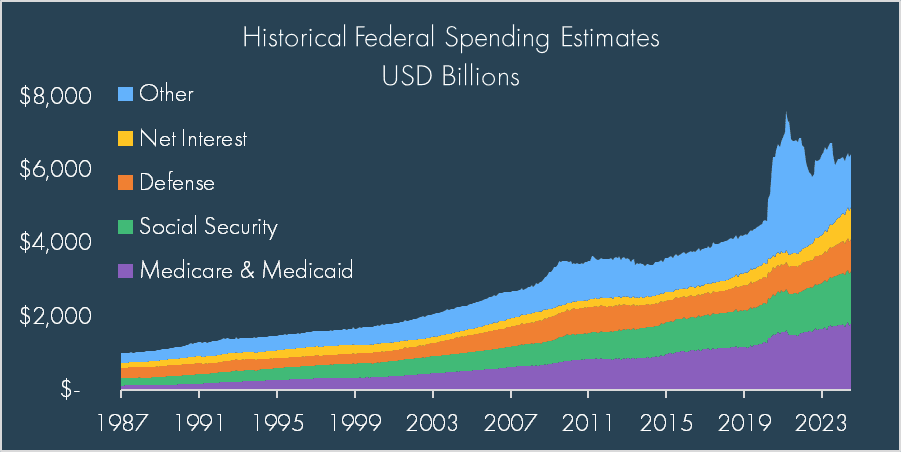
The complexion of the fiscal situation has deteriorated for well-known reasons, including unprecedented levels of spending in response to the COVID-19 pandemic, inflation driving mandatory spending increases in areas such as Social Security without an offsetting increase in social insurance taxes, and higher interest rate costs, to name a few primary drivers.
The budget chart below highlights the lopsided predicament: Our government’s spending over the last 12-months exceeded revenue by $1.6 trillion and the Congressional Budget Office (CBO) estimates a 2024 fiscal year deficit of $1.9 trillion[4]:
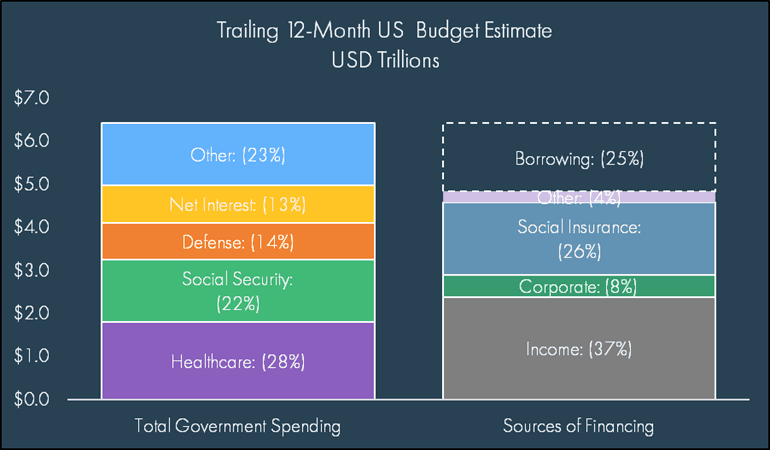
Source: Bloomberg as of 7/31/2024; Please see important disclosures at the end of this material.
Absent an increase in taxes or cut in spending, the only way to solve the budget deficit is by borrowing more, but with elevated rates, borrowing comes at a much higher cost.
When we look at the current deficit, there are no politically appealing places to cut that can make a meaningful impact on the deficit spending. The tough reality is that roughly 75% of spending comes from four main categories: healthcare, Social Security, defense, and interest costs. If you add in income security and veteran benefits and services, you’ve just accounted for roughly 90% of the U.S. federal budget. Many politicians loathe the idea of touching any of these categories, given the significance of each to their respective contingents.
How did we get here? It takes two to tango.
In simplistic terms, more borrowing is driven by spending outpacing tax revenues for the US government. To cover the shortfall, the U.S. Treasury taps the global capital markets through the issuance of government-backed bills, notes and bonds to cover the additional funds needed for spending. While politicians of all stripes like to point fingers at the opposition party, the blame for the ongoing fiscal imbalance spans both political parties.
Fiscal discipline has not been a popular rallying cry from voters, and politicians have acted accordingly. The non-partisan Committee for a Responsible Federal Budget (CRFB) estimates that bi-partisan spending approvals accounted for 77% of the enormous increase in debt (as a % of GDP) since 2001, the last time the federal government ran a budget surplus[5]. In looking at the details, their analysis highlights the primary legislative actions leading to higher deficits and debt issuance by the Treasury: tax cuts, entitlement and discretionary spending increases, and COVID-19 pandemic era spending, in that order. Ultimately, the basic math of the issue shows that it is both a revenue and a spending problem driven by both sides of the aisle.
Source: Bloomberg as of 7/31/2024; Please see important disclosures at the end of this material.
Source: Bloomberg as of 7/31/2024; Please see important disclosures at the end of this material.
Current budget projections offer little in the way of comfort. The CBO estimates that our annual budget deficit will grow to $2.8 trillion by 2034, bringing net public debt as a percent of GDP to 122%[6]. Even more concerning, current projections assume that the provisions of the 2017 Tax Cuts and Jobs Act (TCJA) will expire at the end of 2025. Currently, both Democrat and Republican candidates have said they will not let this happen, but just extending the individual income tax provisions of the TCJA would cost an estimated $3.3 trillion over the next 10 years.[7]
Does the deficit matter? Not yet but getting close.
When most individuals, corporations, or sovereign entities borrow extreme amounts, market forces can arise and, whether the entity likes it or not, impose fiscal discipline by raising the cost to borrow money. Individuals know this well, as U.S. citizens have a credit score that provides a clear indication of their credit worthiness: carry too much debt or stop paying your bills, your score goes down and lenders will either charge a higher rate or stop lending to you all together.
The details and structure, of course, vary, but businesses, and even countries, operate in a similar structure: grossly overborrow and/or stop paying back lenders, and lenders will charge higher rates, demand greater concessions, or stop lending to you all together. Countries can sometimes cheat the system to a degree by printing more currency to pay back lenders, but even this can only do so much as it drives up inflation, devalues their currency, and ultimately results in lenders demanding a higher yield or not lending at all.
But the U.S.? Well, the U.S. occupies a special position.
In April 2023, we wrote about the U.S. dollar and its importance to the global economy as the global reserve currency. In short, as the global reserve currency, foreign nations hold significant U.S. dollar reserves for safety and international transactions. Importantly, they don’t just exchange their currency for dollars and put those dollars in a vault; they use those dollars to buy U.S. Treasuries.
This means that aside from the natural market forces that simply evaluate one’s credit worthiness and lend based on the borrower’s willingness to repay, the U.S. also has a number of global buyers that (1) require dollars to transact and, therefore, need to buy Treasuries or (2) will buy Treasuries in times of uncertainty, even if that uncertainty is caused by poor U.S. fiscal discipline.
None of these market forces operate in a vacuum, but this combination seemingly gives the U.S. the benefit of extra leeway to stretch their debt and deficits with limited consequence.
There are times, though, when the “credit focused” market force plays a greater role. Obvious indications of these are the credit rating agencies, which downgraded the U.S.’s credit rating in August 2011 (S&P) and more recently in August 2023 (Fitch). Both downgrades moved one step lower from the highest AAA rating to AA+, making the downgrade more symbolic than imposing real consequences, but nonetheless, it illustrates the US’s ability and willingness to pay back our debts do matter.
The other force at play is the bond market, or more specifically, the “bond vigilante”. This term was coined by Ed Yardeni in 1983 to refer to bond traders who demanded higher yields in response to fiscal indiscipline. Bond vigilantes have occasionally reappeared since the early 1980s, but as rates continued their steady march down over the last several decades, their impact has been somewhat muted. However, the fall of 2023 saw some hints that they may be back and watching the current fiscal situation more closely.
How does this impact my investments? It depends.
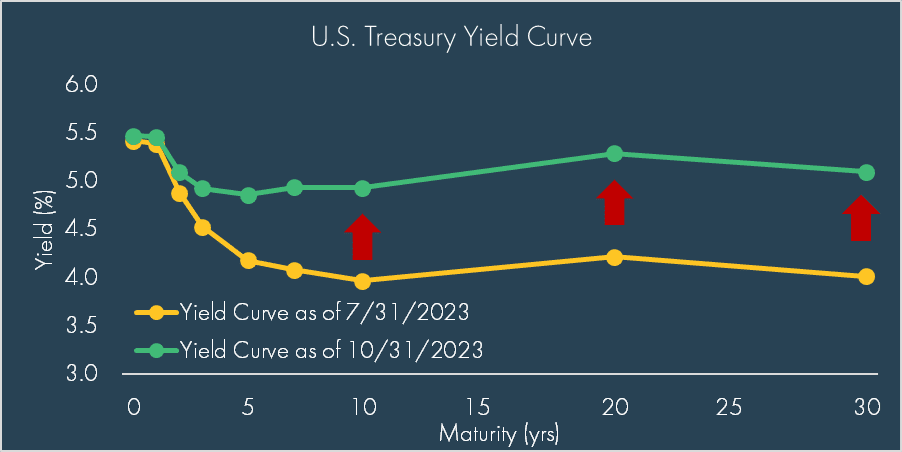
The chart below shows the U.S. Treasury yield curve at the end of July and the end of October last year:
Source: Bloomberg as of 7/31/2024; Please see important disclosures at the end of this material.
Over a span of three months, the yield on the 10-year U.S. Treasury rose from 3.96% to 4.93% while near term rates stayed flat. The cause? A looming glut of Treasury supply combined with fading global demand and lower seasonal liquidity.[8]
The market response? As shown above, longer-term yields rose quickly and markets sold off, with the S&P 500 Index falling more than 10% from July 31st to October 27th. This selloff was likely exacerbated by Hamas’s attack on Israel on October 7th. Whether the surge in yields was a function of “bond vigilantes” or simple market forces is a subject for debate, but nonetheless, it highlighted the potential consequences for ongoing imprudent fiscal discipline.
This recent episode clearly highlights the precarious nature of our fiscal situation. Markets do not like uncertainty and any hint of an unwillingness by the U.S. to pay its debt can cause significant concern. While there were certainly other market forces at play in 2023, the rapidly rising yields generally weighed on risk assets. What performed well? Somewhat ironically, the US dollar was one of the best performing assets, rising nearly 5% against a broad basket of currencies from the end of July through October. Other traditional safe haven assets, such as gold and fixed income, performed better than stocks, though rising yields still weighed on fixed income assets.
However, what happened next is almost equally as important.
In response to low demand and rising yields, the Treasury shifted tactics, moving to issue more debt on the short end of the curve, where demand was abundant as investors poured money into money market funds, easing the pressures on the longer end of the curve, where demand was softer and credit risks were starting to appear. Additionally, the Federal Reserve signaled an end to their rate hiking cycle on November 1st, sending bond yields lower and equity markets off to the races – the S&P 500 rose 27.6% from October 31st to March 28th. This response emphasizes the tricky balance investors have to navigate: the outcome of a default could be catastrophic, but there are major institutions determined to prevent that from happening.
But what about the fiscal situation? We live to die another day.
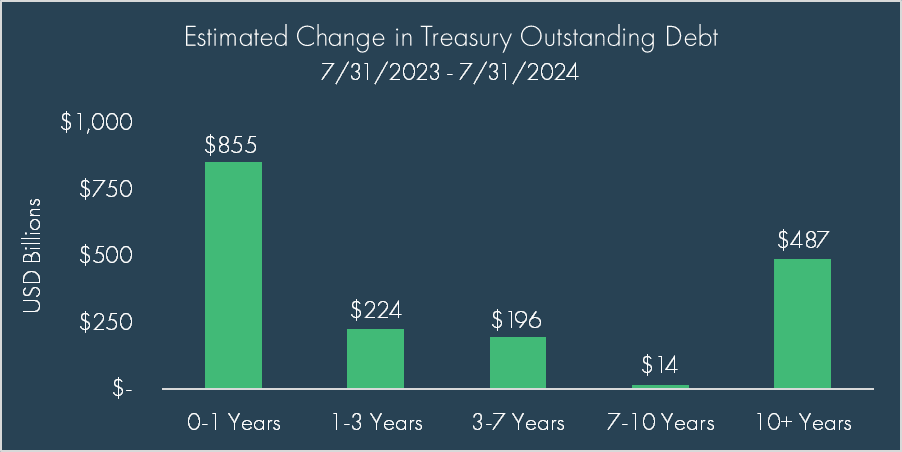
The dual efforts of the Treasury and Federal Reserves enabled the Treasury to refill their coffers, though it’s hard to say that we are in a more sustainable fiscal position than before, as the bulk of new borrowing has come by issuing shorter dated Bills, which mature in one year or less:
Source: Bloomberg as of 7/31/2024; Please see important disclosures at the end of this material.
Borrowing more aggressively at the short end of the curve was somewhat offset by also issuing more aggressively at the long end, but of the $1.8 trillion of additional Treasury issuance over the last 12 months, nearly 50% has come from Bills. While this may indeed be the best course of action for the Treasury, it does come with a cost as the inverted yield curve makes issuing shorter dated Bills, which yield closer to 5%, more expensive for taxpayers.
How does this end? No one knows.
To be clear, debt levels alone are not the issue as the U.S. does not lack an ability to pay its debts. 17% of revenue going to interest payments is painful, but not crippling. Japan has carried a debt-to-GDP ratio of more than 100% for decades (currently above 200%), yet it remains one of the largest and most important economies in the world. To be sure, its stagnant economic growth rate since the early 1990’s should serve as a potential warning. More important than its ability to pay, the U.S. is shaking confidence in its willingness to pay its debt and its apparent, bipartisan unwillingness to curb deficit spending.
As the reserve currency and largest economic and military power in the world, the U.S. has a significant amount of leeway to stretch itself financially. With no governing limit for how far it can stretch itself and voters continually clamoring for more benefits and less taxes, politicians have very little incentive to impose fiscal discipline.
Decisions will need to be made though. The TCJA expires next year. The interest expense continues to rise. Social Security pays out more than it takes in and the current Old-Age and Survivors Insurance Trust Fund is expected to be depleted in 2035, at which point Social Security benefits will experience a mandatory 25% reduction in benefits as the current law is written.[9] Assuming that short-sighted solutions such as “printing more money” or defaulting on debt payments are not on the table, policy makers have three choices to address these decisions: cut spending, raise taxes, or borrow more – something that may get more and more difficult over time. None of these options are painless, but at some point, relentless spending will force austerity, voluntarily or involuntarily.
So, what should we do?
The almost universal selloff across assets during last year’s rise in yields illustrates the difficulty in protecting against such a catastrophic event. In some ways, positioning one’s portfolio for an Argentina-like default[10] on U.S. debt could be compared to positioning one’s portfolio for a nuclear war – the odds are incredibly low but the outcome so catastrophic that true protection would require drastic measures (i.e. buy guns and ammo rather than stocks and bonds). As such, we don’t recommend making tactical shifts in preparation for something that is unlikely to happen.
Instead, we encourage clients to take advantage of the benefits today while planning for a reduction in those benefits in the future. Additionally, we recommend investing in diversified portfolios that seek to protect on the downside, through asset classes such as fixed income and real assets and diversify upside exposure via a globally diversified equity portfolio – not just the S&P 500.
It can be tempting to take drastic measures in one’s portfolio to protect against a concerning future, but it’s important to remember that markets are incredibly resilient, surviving multiple world wars, energy crises, depressions, inflation scares, a complete move to fiat currency, terrorist attacks, and the list goes on. The fiscal problems are real, but solutions are possible – though real solutions will take immense fortitude by elected leaders. In the meantime, rest assured that we will continue to evaluate the risks and opportunities to help your portfolio be positioned to give you the highest probability of success in meeting your financial goals.
[1] Team Fortress 2 – Meet the Pyro
[2] https://www.treasurydirect.gov/government/historical-debt-outstanding/
[3] Source: Bloomberg as 8/29/2024
[4] A more detailed breakdown can be found on the Treasury’s website, but we use the above data from Bloomberg to easily compare and contrast the different components of our government’s budget.
[5] https://www.crfb.org/papers/riches-rags-causes-fiscal-deterioration-2001
[6] https://www.cbo.gov/publication/60039; CBO estimates can differ from White House estimates due to seasonal adjustment differences and differences in assumptions and projections, including legislative and policy assumptions and economic growth estimates.
[7] https://www.cbo.gov/publication/60114
[8] In January 2023, the U.S. hit its debt ceiling and we wrote about the “extraordinary measures” taken by the Treasury Department to keep paying government bills while lawmakers decided whether they were going to raise the debt ceiling. Essentially, this meant prioritizing certain payments and spending down cash on hand since they could no longer issue new debt. Five months later, as the Treasury exhausted the use of “extraordinary measures” and approached default, Congress reached an agreement to raise the debt ceiling. This allowed the Treasury department to issue more debt and raise desperately needed funds to pay its bills, but there were now new factors at play: previous buyers of Treasury bonds (such as China, who has been seeking to reduce their reliance on the U.S. dollar, and the Federal Reserve, who has been slowly reducing their balance sheet holdings) were backing off and the debt ceiling deliberations cast fresh doubts on the U.S.’s willingness to repay their debts.
[9] https://www.ssa.gov/policy/trust-funds-summary.html
[10] https://www.ft.com/content/b9a5f679-3f6d-4867-9517-e8437492ec19
DISCLOSURES
© 2024 Advisory services offered by Moneta Group Investment Advisors, LLC, (“MGIA”) an investment adviser registered with the Securities and Exchange Commission (“SEC”). MGIA is a wholly owned subsidiary of Moneta Group, LLC. Registration as an investment adviser does not imply a certain level of skill or training. The information contained herein is for informational purposes only, is not intended to be comprehensive or exclusive, and is based on materials deemed reliable, but the accuracy of which has not been verified.
Trademarks and copyrights of materials referenced herein are the property of their respective owners. Index returns reflect total return, assuming reinvestment of dividends and interest. The returns do not reflect the effect of taxes and/or fees that an investor would incur. Examples contained herein are for illustrative purposes only based on generic assumptions. Given the dynamic nature of the subject matter and the environment in which this communication was written, the information contained herein is subject to change. This is not an offer to sell or buy securities, nor does it represent any specific recommendation. You should consult with an appropriately credentialed professional before making any financial, investment, tax or legal decision. An index is an unmanaged portfolio of specified securities and does not reflect any initial or ongoing expenses nor can it be invested in directly. Past performance is not indicative of future returns. All investments are subject to a risk of loss. Diversification and strategic asset allocation do not assure profit or protect against loss in declining markets. These materials do not take into consideration your personal circumstances, financial or otherwise.
DEFINITIONS
The U.S. Treasury yield curve refers to a line chart that depicts the yields of short-term Treasury bills compared to the yields of long-term Treasury notes and bonds. The chart shows the relationship between the interest rates and the maturities of U.S. Treasury fixed-income securities. The Treasury yield curve (also referred to as the term structure of interest rates) shows yields at fixed maturities, such as one, two, three, and six months and one, two, three, five, seven, 10, 20, and 30 years. Because Treasury bills and bonds are resold daily on the secondary market, yields on the notes, bills, and bonds fluctuate.
The Bloomberg U.S. Aggregate Bond Index is an index, with income reinvested, generally representative of intermediate-term government bonds, investment grade corporate debt securities and mortgage-backed securities.