Tim Side, CFA – Investment Strategist
Chris Kamykowski, CFA, CFP® – Head of Investment Strategy and Research
Early this year, January 11th to be exact, we received an email from our Fixed Income team following the December 2023 Consumer Price Index (CPI) report. One comment stood out: “The market is pricing in a better than 100% chance of a rate cut by the May 1st Fed meeting. Fed officials have said they expect at least three rate cuts in 2024, but the futures market is more optimistic and projects 5-6 rate cuts.”
In April 2023, we wrote about the disconnect between the market and Fed. Importantly, we highlighted how even the Fed’s own median estimate for the Fed Fund Rate is never correct, something that appears to be happening yet again. However, we also noted a wildcard scenario that neither the market nor the Fed was considering as their “base case” – sticky inflation.
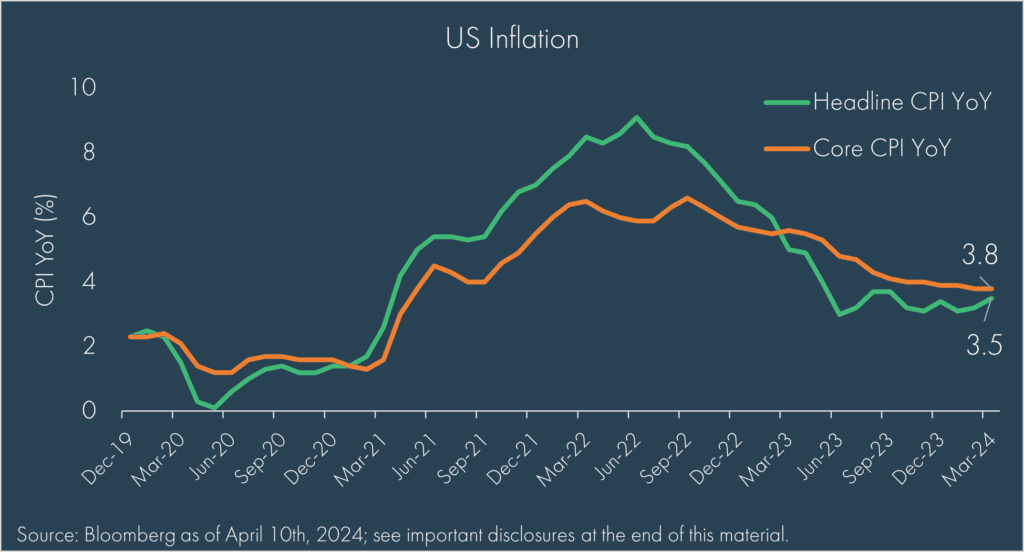
As we saw in the most recent CPI print, inflation appears, in fact, to have become a bit stuck at a level north of 3%. After falling steadily from its peak in 2022, both headline and core CPI (ex-energy and food) measures remain much higher than the Fed’s communicated target of 2.0-2.5%.
Of course, it is not just inflation that has surprised to the upside. Even despite the recent April payroll report coming in below expectations, the labor market has remained a source of strength with unemployment levels remaining below 4%. This, alongside fiscal spending, has supported a growing economy and consumer spending. This strength has been surprising relative to the market expectations that the rapid increase in rates would drive the economy into a recession and thereby induce the Fed to lower rates.
All this news has driven a reset in rate cut expectations. In a far cry from January 11th’s “more than 100% chance” expected cut in May, we have zero cuts expected in May and only 1-2 total cuts for all of 2024 expected. In their most recent meeting concluding May 1st, the Fed acknowledged “…in recent months, there has been a lack of progress towards the Committee’s two percent objective.” While there was no updated Dot Plot following the most recent meetings, the Fed has all but stated that 2-3 cuts are unlikely at this point.
Every day, new data comes in that seems to give credence to both views that the Fed will cut or that the Fed won’t cut. Given the current environment, this post will attempt to provide some insights on why the Fed would consider cutting rates.
Historical Perspective on Past Easing Cycles
The old adage “history doesn’t’ repeat, but it does rhyme” seems more than appropriate when we try to judge the reaction function of the Fed today. However, does the past provide any guide for future moves or are past easing cycles not created equal, thereby limiting their predictive ability? To find out, let’s examine past easing cycles over the last 35 years, specific economic measures at the time of the first easing, and market performance leading up to the first easing.
To set the stage, there have been six distinct easing cycles since 1989. They have lasted an average of 17 months and have occurred on average ten months following the end of a hiking cycle (pause). While only two cutting cycles (2001 and 2007) came as the economy was entering a recession, four of the five easing cycles did end up preceding a recession within 12 months from the first cut.
To help visualize where economic and market conditions were situated, the table below outlines a few key items. The color coding helps to identify whether the economic reading is, or trending, positive or negative at the time of first rate cut. Real GDP, Institute for Supply Chain Management (ISM) numbers, unemployment, and initial jobless claims are absolute measures while the other measures look at the level relative to three months ago.
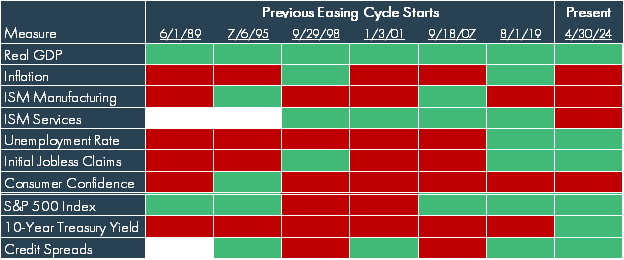
In looking at the economic measures, it appears to be a mixed bag of trends with 1989, 1998, and 2001 showing “clear” signs of economic slowing, while 1995 and 2019 were treading water or positive. 2007’s easing cycle start was a proactive hedge against issues in the mortgage and housing market which, at the time, was expected to be “contained”. Notably, the data was always mixed to some degree. When we compare these periods to our current levels or trends for these same items, we see the economy generally does not necessarily appear to need a rate cut, despite the market’s desire for one. Yes, there is an apparent slowing in manufacturing and services, but employment remains robust.
An important sidenote to the past easing cycles: no easing cycle began during a presidential election year, though the Fed has been active during past presidential election years. Additionally, the cuts in 1995 were the only cuts following an increase in rates specially intended to rein in inflation.
Why would the Fed cut rates now?
The Federal Reserve’s mandate is to conduct monetary policy “so as to promote the goals of maximum employment, stable prices, and moderate long-term interest rates”[1] – this is commonly referred to as the dual mandate of stable prices and full employment (interest rates and prices commonly grouped together).
Ultimately, the Fed wants to keep rates high enough to ensure that inflation comes down but not too high as to severely restrict economic growth and send the US into a recession. As the table above highlights, most key indicators are currently in a positive or flat trend – though a “red” inflation reading would have the inverse effect on how the Fed should respond. This all begs the question: why is the Fed even considering cutting rates?
Time and again, the Fed has noted that they will be “data dependent” when considering policy decisions, yet increasingly, the belief that the Fed is politically motivated in their actions has gained significant traction – a serious consideration as we approach a presidential election later this year. For right or wrong, both schools of thought, data dependent and political motivations, claim to have merit, so we will address both to help answer why the Fed would still consider cutting rates.
Data Dependence
As illustrated in the first chart, inflation appeared to be much stickier than expected with both core and headline CPI well above 3% as of the latest reading. Yet while most consumers, who have faced higher everyday food prices recently, may find this number intuitive, the actual drivers of the recent inflation numbers have come from two key areas: shelter and auto insurance. As illustrated in the chart below, the green bars show the contribution of core services to inflation with the top two green bars highlighting the impact of shelter and insurance prices.
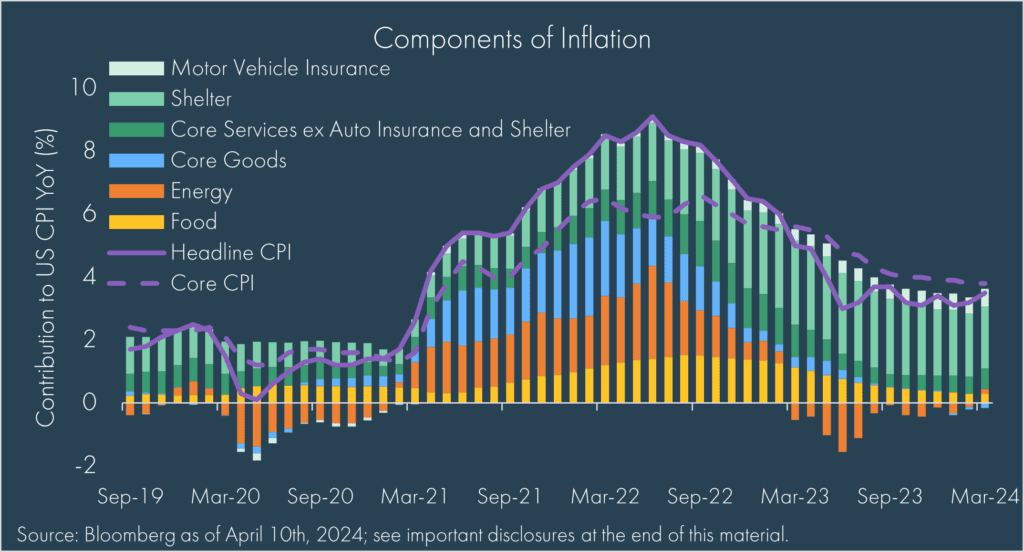
That auto insurance, a 2.5% weight in the CPI calculation, is responsible for more than 16% of overall inflation speaks to the concentrated drivers of the current inflation readings. Said differently, if auto insurance prices had no inflation, the most recent headline inflation number would have come in at 2.9% – a higher number than the Fed would like, but below the headline grabbing number of 3.5%.
We highlight this detail because it illustrates the importance of looking through the headline numbers (as the Fed is doing) when asking why the Fed might cut. If inflation has come down to 2.9%, then we are much closer towards the Fed’s 2% goal and cuts in the near future may not seem that unreasonable. Should the Fed simply exclude auto insurance prices when deciding when to cut? Probably not, but it could certainly be a consideration.
On the employment side, the strength of the labor market has continually been pointed to as a key support for the US economy. Indeed, since February 2022, the US unemployment rate has stayed below 4% – a number that by most measures would be considered “full employment”. This strength continued in March with a gain of 303,000 (revised upward to 315,000 in May), although the April payroll report of 175,000 additions was well below consensus estimates.
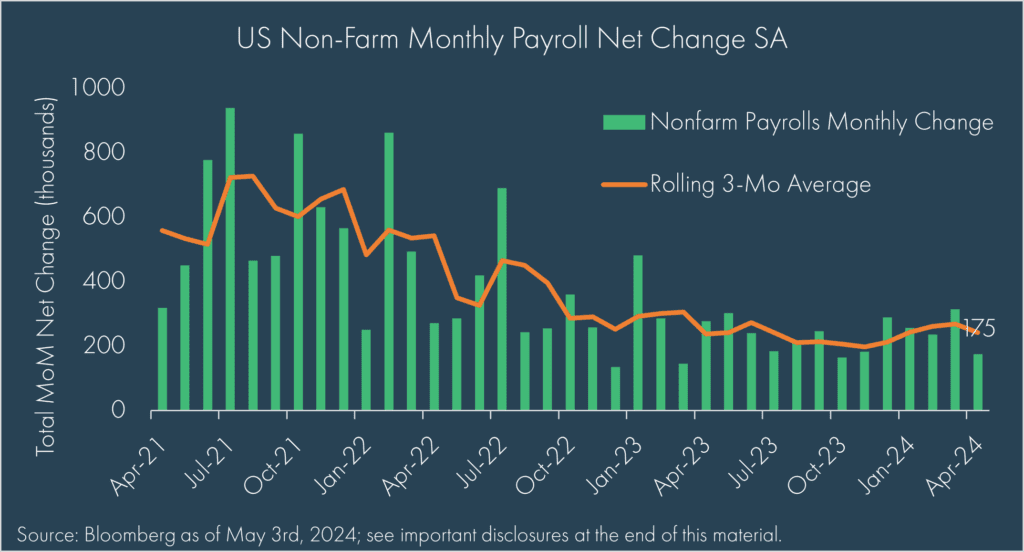
Once again, though, the top line numbers fail to capture that roughly 50% of new jobs being added are coming from government and healthcare jobs, and a further analysis of the household report indicates that the majority of jobs being added are part-time jobs as well.
The tightness of the labor market and elevated participation rates gives comfort that those who want a job, can get a job, but the details of the jobs being added provide some additional clarity that things may not be as “booming” as headline numbers might indicate.
So as the Fed looks at their dual mandate, they have inflation appearing to be sticky, but this could be driven more by outliers, and employment appearing strong, but potential weaknesses in the quality of jobs being added. Neither of these “complications” necessitate cuts in and of themselves but are data-driven considerations that the Fed has when determining if, and when, to cut.
Political Motivations
In our Fed vs. Market piece, we noted that “Powell has carefully navigated the political pressure thus far, but if the early ‘80s are any indication of what could come, then the pressure has only just begun.” Compared to what Former Fed Chairman Paul Volcker dealt with, it is hard to say Powell has felt serious pressure, but as rates stay elevated, the pressures have certainly increased.
Not all political affiliations of the Federal Reserve members are known, though a study conducted by the Independent Institute in 2022 found that “At the Board of Governors of the Federal Reserve System, there are 97 Democrat economists and only two Republican economists.”[2] The article does also note that within that cohort, there are also 38 with no party affiliation, 278 not registered, and one Libertarian.
The FOMC is chaired by Jerome Powell, a registered Republican, appointed to be a Fed Governor by President Barack Obama (Democrat), then Fed Chair by President Donald Trump (Republican), then reappointed as Fed Chair by President Joe Biden (Democrat).
It is not for us to speculate on whether the Fed will try to “keep” Biden in office. There are some who believe it has potentially happened before, when the Fed kept rates low in the presidential election year of 1972 even as inflation remained high.[3] However, given inflation came roaring back in the ‘70s, Powell appears to be acutely aware of the dangers of making decisions irrespective of the economic data.
To be sure, there are other “political” pressures beyond the presidency since higher rates do not affect all entities equally. There are more, but four key groups are currently struggling in the face of higher rates:
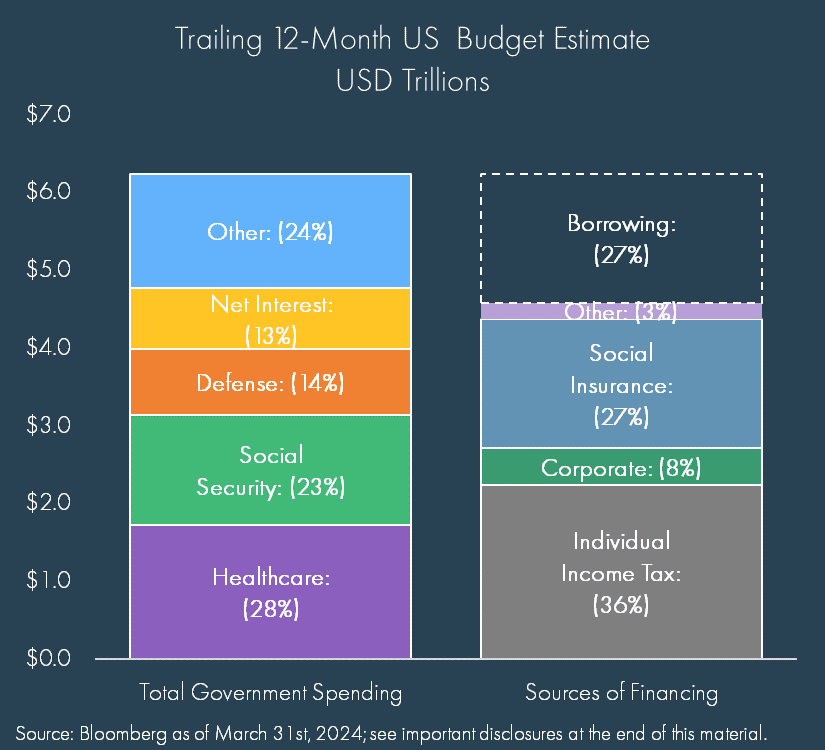
1 – US Federal Government: This $34.6 trillion debt elephant in the room will be a future article on its own, but the key takeaway is that the US is running a massive budget deficit and interest costs are consuming a greater portion of spending. The Treasury has struggled to issue longer dated bonds so as not to force rates higher, instead funding the majority of spending via short-term Treasury issuance, further exacerbating the interest expense. There are no easy solutions to this issue, but lower rates would certainly help.
2 – Global Currencies: Last year, we wrote about concerns over the US dollars dominance and whether it would retain its reserve currency status. Today, that dominance is causing new headaches for countries around the world: the dollar keeps getting stronger. A weaker currency can help boost exports but runs the risk of accelerating inflation in that country, in addition to losing investors. On the flip side, a stronger currency is not necessarily bad for an import heavy country like the US, but it can be a drag on exports, like we saw in recent GDP numbers.
3 – Small Companies: When inflation started to rise in 2021, concerns over a lack of pricing power led investors to discount smaller companies. As the Fed raised rates, concerns pivoted to the debt profile of smaller companies, which generally carry shorter maturities and more floating rate debt than larger companies. Indeed, at the end of April, roughly 40% of S&P 500 Index (large cap) debt is expected to mature in the next five years while more than 65% of the Russell 2000 Index (small cap) debt (nearly half of which is floating rate) matures in the next five years. Tack on the fact that more than 40% of Russell 2000 companies are unprofitable, and it’s easy to understand why small companies have underperformed.
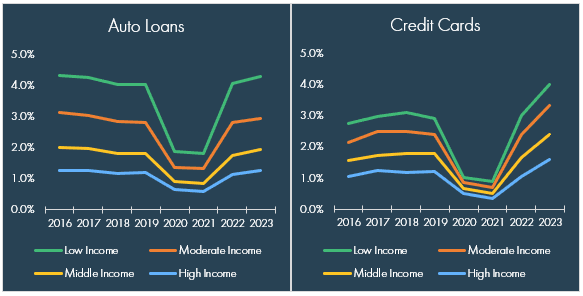
4 – Lower Income Households: Once “flush with cash” following COVID-19 stimulus payments and a moratorium on student loan payments, lower income households are feeling the squeeze from inflation and higher rates combined with the resumption of student loan payments. The data below, published by the New York Federal Reserve earlier this year[4], illustrates rising early delinquencies across the board, but more significantly among lower income households (green line):
These four considerations are not all inclusive but highlight some of the “political” pressures the Fed could be facing apart from the economic data.
Conclusion
The analysis above only scratches the surface of the mixed data that the Fed is looking at. The key takeaway? It’s very complicated. From headline numbers to details, or from one data point to the next, any given day provides data to support the Fed to cut rates, hold steady, or even raise rates. The Fed is aware of this and acutely sensitive to real, or perceived, political pressures as well.
As we write, the market is expecting a rate cut in November with a 50% chance of another cut in December.[5] In their most recent meeting, the Fed acknowledged the challenges, and Powell noted in the press conference afterwards: “If we had a path where inflation proves more persistent than expected, and where the labor market remains strong but inflation is moving sideways, and we’re not gaining greater confidence, that would be a case in which it could be appropriate to hold off on rate cuts.”
Inflation moving sideways with a strong labor market seems like a fitting description of the current economic situation, and so, the Fed held rates steady in May.
The data is mixed and each input plays into the overall decision – should the Fed cut this year? Maybe. Will the Fed cut this year? No one knows for sure.
What does seem safe to say is that for the time being, absent a serious recession, rates are likely to stay elevated relative to the last decade or so. We also discussed in our geopolitical assessment that a destabilizing world is likely to keep inflation elevated relative the last several decades. As such, we are not adjusting portfolios based on the unknown factor of whether the Fed cuts rates once, twice, or not at all in 2024. Instead, we prefer to take a longer-term approach to ensure that client portfolios are built for resilience and well-positioned to achieve their specific goals over the years to come, regardless of what the Fed does today.
[1] https://www.federalreserve.gov/monetarypolicy/monetary-policy-what-are-its-goals-how-does-it-work.htm
[2] https://www.independent.org/publications/article.asp?id=14021
[3]https://www.aeaweb.org/articles?id=10.1257/jep.20.4.177
[4] https://www.newyorkfed.org/outreach-and-education/household-financial-stability/the-state-of-low-income-america-credit-access-housing-jan-24
[5] Notably, the US presidential election is on Tuesday, November 5th. The Fed’s November meeting will take place on Wednesday, November 6th and November 7th.