Chris Kamykowski, CFA, CFP® – Head of Investment Strategy and Research
Tim Side, CFA – Investment Strategist
Monthly Observations
Dispersion of Returns Highlights First Month of Summer
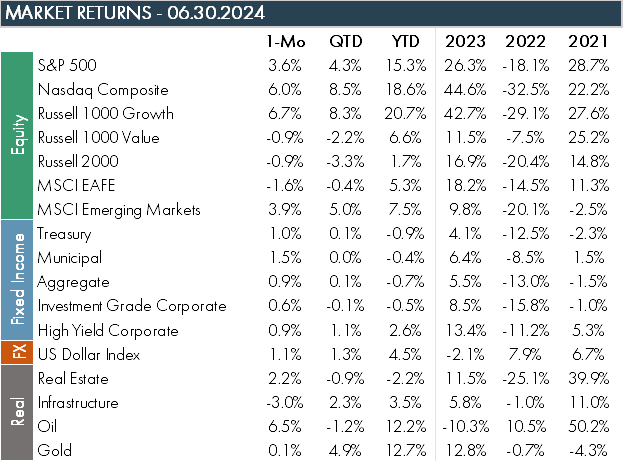
The haves and have-nots were obvious in June as the second quarter came to close. The persistently rewarded themes of growth and technology pushed US large cap to the top once again, especially versus small caps and non-US developed equities. While the AI theme has clearly supported the technology sector within large cap (up 28.6% this year), small cap’s technology stocks lag with a 9.9% return year-to-date. Non-US trailed US large cap by 5.2% in June, the largest since April 2020’s 6.4%. Non-US stocks were affected by election concerns heading into July by two of the largest country exposures: France (-7.5%) and the United Kingdom (-1.8%). Emerging markets, while lagging non-US developed, produced a solid 3.9% return in June, led by Taiwan, South Africa, South Korea, and India.
Fed Continues to Hold Rates Steady while Other Central Banks Cut
As expected, the Federal Reserve held rates steady at their June meeting and raised their expectations for where rates would be at the end of the year, indicating only one cut is now expected in 2024. Meanwhile, the Bank of Canada, European Central Bank, and Swiss National Bank, all cut rates in June as countries grapple with nuanced circumstances around their own respective economy, inflation, and currency.
The Year of Elections
The US is far from the only country with an election this year, as more than four billion people around the world, or more than 60% of GDP, are expected to vote in 2024. The last month or so came with several election surprises, notably in South Africa and India, where voters moved away from the status quo and forced the leaders to form coalition governments. Mexico saw its first female president elected in a sizable landslide, prompting concerns over the leading party’s concentration of power. France also saw turmoil as center-left leader President Macron looked set to lose his majority to the far-right leader Le Pen, though July voting appears to have put that fear to rest for the time being.
Commentary From Asset Managers
Venture Capital Manager
Public markets do not tell the whole story. IPOs are recovering and are up 56% post 2022 and public SaaS valuation multiples have reset to historical norms. Notably, the venture companies pursuing an IPO are increasingly larger than they were in the past.
Global Asset Manager
Tail risks have occurred more frequently in this generation of money management relative to prior generations, leading to increased skepticism. Because of this, there is an over-emphasis on protecting against scenarios such as stagnation and stagflation, which are historically very rare occurrences.
Fixed Income Manager
It remains to be seen whether the US economic strength is durable or merely fueled by pandemic-period government support and a rising debt-to-GDP ratio. If the US eventually faces a fiscal reckoning, debt consolidation through entitlement spending reforms and higher taxes is likely. However improbable it seems in the current political environment, the seemingly untouchable areas of fiscal policy may have to evolve.
Chart of the Month
SOURCES
Morningstar Direct as of 06.30.2024
Bloomberg as of 06.30.2024
DISCLOSURES
© 2024 Advisory services offered by Moneta Group Investment Advisors, LLC, (“MGIA”) an investment adviser registered with the Securities and Exchange Commission (“SEC”). MGIA is a wholly owned subsidiary of Moneta Group, LLC. Registration as an investment adviser does not imply a certain level of skill or training. The information contained herein is for informational purposes only, is not intended to be comprehensive or exclusive, and is based on materials deemed reliable, but the accuracy of which has not been verified.
Trademarks and copyrights of materials referenced herein are the property of their respective owners. Index returns reflect total return, assuming reinvestment of dividends and interest. The returns do not reflect the effect of taxes and/or fees that an investor would incur. Examples contained herein are for illustrative purposes only based on generic assumptions. Given the dynamic nature of the subject matter and the environment in which this communication was written, the information contained herein is subject to change. This is not an offer to sell or buy securities, nor does it represent any specific recommendation. You should consult with an appropriately credentialed professional before making any financial, investment, tax or legal decision. An index is an unmanaged portfolio of specified securities and does not reflect any initial or ongoing expenses nor can it be invested in directly. Past performance is not indicative of future returns. All investments are subject to a risk of loss. Diversification and strategic asset allocation do not assure profit or protect against loss in declining markets. These materials do not take into consideration your personal circumstances, financial or otherwise.
Manager comments come from discussions with various asset managers and are broad commentary on sectors and not be considered recommendations by any asset manager. These comments do not necessarily reflect strategy allocations or the view or opinion of MGIA or Moneta Group.
DEFINITIONS
The S&P 500 Index is a free-float capitalization-weighted index of the prices of approximately 500 large-cap common stocks actively traded in the United States.
The NASDAQ Composite Index is a market capitalization weighted index with more than 3000 common equities listed on the NASDAQ Stock Market.
The Russell 1000® Index is an index of 1000 issues representative of the U.S. large capitalization securities market.
The Russell 1000® Growth Index measures the performance of the large-cap growth segment of the U.S. equity universe. It includes those Russell 1000 companies with higher price-to-book ratios and higher forecasted growth values.
The Russell 1000® Value Index measures the performance of those Russell 1000 Index securities with lower price-to-book ratios and lower forecasted growth values, representative of U.S. Securities exhibiting value characteristics.
The Russell 2000® Index is an index of 2000 issues representative of the U.S. small capitalization securities market.
The MSCI EAFE Index is a free float-adjusted market capitalization index designed to measure the equity market performance of developed markets, excluding the U.S. and Canada.
The MSCI Emerging Markets Index is a float-adjusted market capitalization index that consists of indices in 21 emerging economies.
Bloomberg U.S. Treasury Bond Index includes public obligations of the US Treasury, i.e. US government bonds. Certain Treasury bills are excluded by a maturity constraint. In addition, certain special issues, such as state and local government series bonds (SLGs), as well as U.S. Treasury TIPS, are excluded.
The Bloomberg U.S. Municipal Index covers the USD-denominated long-term tax exempt bond market. It includes general obligation and revenue bonds, which both can be pre-refunded years later and get reclassified as such.
The Bloomberg U.S. Aggregate Bond Index is an index, with income reinvested, generally representative of intermediate-term government bonds, investment grade corporate debt securities and mortgage-backed securities.
The Bloomberg US Corporate Bond Index measures the investment grade, fixed-rate, taxable corporate bond market. It includes USD-denominated securities publicly issued by US and non-US industrial, utility and financial issuers.
The Bloomberg US Corporate High Yield Bond Index measures the USD-denominated, high yield, fixed-rate corporate bond market. Securities are classified as high yield if the middle rating of Moody’s, Fitch and S&P is Ba1/BB+/BB+ or below. Bonds from issuers with an emerging markets country of risk, based on the indices’ EM country definition, are excluded.
The US Dollar Index measures the US dollar against six global currencies: the euro, Swiss franc, Japanese yen, Canadian dollar, British pound, and Swedish krona.
The FTSE Nareit All Equity REITs Index is a free-float adjusted, market capitalization-weighted index of U.S. equity REITs. Constituents of the index include all tax-qualified REITs with more than 50 percent of total assets in qualifying real estate assets other than mortgages secured by real property.
The S&P Global Listed Infrastructure index measures the performance of global companies that are engaged in infrastructure and related operations. It provides liquid and tradable exposure to 75 companies from around the world that represent the listed infrastructure universe. To create diversified exposure, the index includes three distinct infrastructure clusters: utilities, transportation and energy.
Brent crude is the most traded of all of the oil benchmarks, and is defined as crude mostly drilled from the North Sea oilfields: Brent, Forties, Oseberg and Ekofisk (collectively known as BFOE).
The Dow Jones Commodity Index Gold is designed to track the gold market through futures contracts.
The ICE BofA Option-Adjusted Spreads (OASs) are the calculated spreads between a computed OAS index of all bonds in a given rating category and a spot Treasury curve. An OAS index is constructed using each constituent bond’s OAS, weighted by market capitalization. The Corporate Master OAS uses an index of bonds that are considered investment grade (those rated BBB or better). When the last calendar day of the month takes place on the weekend, weekend observations will occur as a result of month ending accrued interest adjustments.
The ICE BofA Option-Adjusted Spreads (OASs) are the calculated spreads between a computed OAS index of all bonds in a given rating category and a spot Treasury curve. An OAS index is constructed using each constituent bond’s OAS, weighted by market capitalization. The ICE BofA High Yield Master II OAS uses an index of bonds that are below investment grade (those rated BB or below).
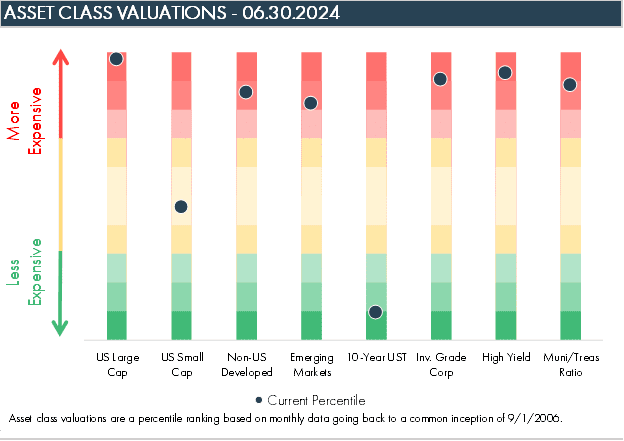
Asset class valuations are a percentile ranking based on monthly data going back to common inception of 9/1/2006. The US Large Cap percentile is the average percentile ranking of the trailing P/E, P/B, P/S, and P/C ratio of the S&P 500 Index. The US Small Cap percentile is the average percentile ranking of the trailing P/E, P/B, P/S, and P/C ratio of the Russell 2000 Index. The International Developed percentile is the average percentile ranking of the trailing P/E, P/B, P/S, and P/C ratio of the MSCI EAFE NR Index. The Emerging Market percentile is the average percentile ranking of the trailing P/E, P/B, P/S, and P/C ratio of the MSCI Emerging Markets NR Index. The 10-Year US Treasury percentile is the percentile ranking of the 10-Year US Treasury yield. The Investment Grade percentile is the percentile ranking of the ICE BofA US Corporate option adjusted spread. The High Yield Corporate percentile is the percentile ranking of the ICE BofA US High Yield corporate option adjusted spread. The Municipal/Treasury percentile is the percentile ranking of the Bloomberg Municipal Index yield divided by the 10-Year US Treasury Yield.