Monthly Observations
Sharp Downdraft Upends Markets
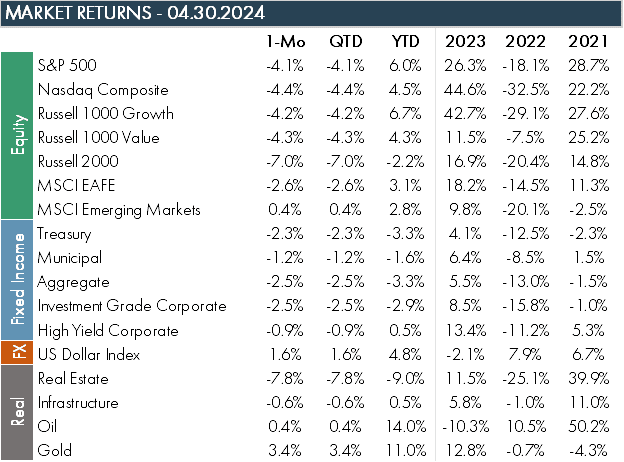
Markets were doused with a bit of seasonal April showers as an uptick in geopolitical drama, surprise to inflation trends, and a sharp change in interest rate expectations weighed on equity and fixed income markets. The S&P 500 fell sharply from its most recent all-time highs set in March, posting its worst monthly return since September 2023. A renewed “higher-for-longer” theme sent small cap stocks lower, with the Russell 2000 posting its worst monthly return (-7.0%) since September 2022. Despite strength in the US Dollar, non-US equity markets were relative “winners” over the month versus US equities. Developed equity markets fell only -2.6%, helped by better relative performance out of the Eurozone and United Kingdom equity markets. Emerging markets were a bright spot as they posted a modest positive return, led by a massive month for China which was up 6.6%. Since the doldrums of January, China is up nearly 17%. Hawkish rhetoric from the Fed and hotter inflation readings prompted a steady rise in Treasury yields over the month, sending bond prices lower.
Less Hawkish Tone by the Fed
For the third straight month in a row, inflation, as measured by the Consumer Price Index, came in hotter than expected, raising questions about how much the Fed will be able to cut rates this year. Rate cut expectations were reduced in number and the timing pushed further into the year. Energy, transportation, and shelter costs were primary contributors to the recent increases in inflation.
Middle East Tensions Remain Elevated
Israel’s strike of Iranian military senior personnel in Syria in early April led to retaliatory attacks by Iran later in the month, putting markets on edge over the potential for an all-out regional war. While Israel conducted a limited strike on Iranian targets, cooler heads prevailed for now in the region.
Commentary From Asset Managers
Global Equity Manager
There is a misconception regarding the attainment of a soft landing, with historical data suggesting otherwise. To achieve a soft landing, specific criteria must be met, including achieving 2% inflation, positive GDP growth, and unemployment near or below 4%. Even then, the problem isn’t getting a soft landing; it is holding on to it. In its 110-year existence, the Fed has secured a soft landing 3 times but has only completely stuck the landing once (1995).
Global Infrastructure Manager
The infrastructure space continues to be driven by market thematics, particularly higher interest rates. In this environment, utilities and communications are the most exposed sectors. There are a lot of cheap stocks in these sectors, but the market doesn’t appear to have much appetite for them until rates start coming down.
Emerging Markets Equity Manager
The AI story clearly continues to have legs. While the leading-edge chip design and software are undoubtedly U.S.-centric, the picks and shovels of AI are made in EM countries. If AI delivers on its promise, every single technology device will have to be re-engineered and upgraded to include or provide access to AI.
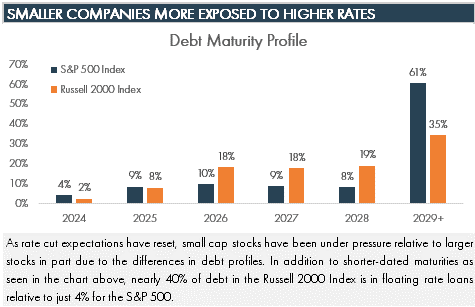
Chart of the Month
SOURCES
Morningstar Direct as of 04.30.2024
Bloomberg as of 04.30.2024
DISCLOSURES
© 2024 Advisory services offered by Moneta Group Investment Advisors, LLC, (“MGIA”) an investment adviser registered with the Securities and Exchange Commission (“SEC”). MGIA is a wholly owned subsidiary of Moneta Group, LLC. Registration as an investment adviser does not imply a certain level of skill or training. The information contained herein is for informational purposes only, is not intended to be comprehensive or exclusive, and is based on materials deemed reliable, but the accuracy of which has not been verified.
Trademarks and copyrights of materials referenced herein are the property of their respective owners. Index returns reflect total return, assuming reinvestment of dividends and interest. The returns do not reflect the effect of taxes and/or fees that an investor would incur. Examples contained herein are for illustrative purposes only based on generic assumptions. Given the dynamic nature of the subject matter and the environment in which this communication was written, the information contained herein is subject to change. This is not an offer to sell or buy securities, nor does it represent any specific recommendation. You should consult with an appropriately credentialed professional before making any financial, investment, tax or legal decision. An index is an unmanaged portfolio of specified securities and does not reflect any initial or ongoing expenses nor can it be invested in directly. Past performance is not indicative of future returns. All investments are subject to a risk of loss. Diversification and strategic asset allocation do not assure profit or protect against loss in declining markets. These materials do not take into consideration your personal circumstances, financial or otherwise.
Manager comments come from discussions with various asset managers and are broad commentary on sectors and not be considered recommendations by any asset manager. These comments do not necessarily reflect strategy allocations or the view or opinion of MGIA or Moneta Group.
DEFINITIONS
The S&P 500 Index is a free-float capitalization-weighted index of the prices of approximately 500 large-cap common stocks actively traded in the United States.
The NASDAQ Composite Index is a market capitalization weighted index with more than 3000 common equities listed on the NASDAQ Stock Market.
The Russell 1000® Index is an index of 1000 issues representative of the U.S. large capitalization securities market.
The Russell 1000® Growth Index measures the performance of the large-cap growth segment of the U.S. equity universe. It includes those Russell 1000 companies with higher price-to-book ratios and higher forecasted growth values.
The Russell 1000® Value Index measures the performance of those Russell 1000 Index securities with lower price-to-book ratios and lower forecasted growth values, representative of U.S. Securities exhibiting value characteristics.
The Russell 2000® Index is an index of 2000 issues representative of the U.S. small capitalization securities market.
The MSCI EAFE Index is a free float-adjusted market capitalization index designed to measure the equity market performance of developed markets, excluding the U.S. and Canada.
The MSCI Emerging Markets Index is a float-adjusted market capitalization index that consists of indices in 21 emerging economies.
Bloomberg U.S. Treasury Bond Index includes public obligations of the US Treasury, i.e. US government bonds. Certain Treasury bills are excluded by a maturity constraint. In addition, certain special issues, such as state and local government series bonds (SLGs), as well as U.S. Treasury TIPS, are excluded.
The Bloomberg U.S. Municipal Index covers the USD-denominated long-term tax exempt bond market. It includes general obligation and revenue bonds, which both can be pre-refunded years later and get reclassified as such.
The Bloomberg U.S. Aggregate Bond Index is an index, with income reinvested, generally representative of intermediate-term government bonds, investment grade corporate debt securities and mortgage-backed securities.
The Bloomberg US Corporate Bond Index measures the investment grade, fixed-rate, taxable corporate bond market. It includes USD-denominated securities publicly issued by US and non-US industrial, utility and financial issuers.
The Bloomberg US Corporate High Yield Bond Index measures the USD-denominated, high yield, fixed-rate corporate bond market. Securities are classified as high yield if the middle rating of Moody’s, Fitch and S&P is Ba1/BB+/BB+ or below. Bonds from issuers with an emerging markets country of risk, based on the indices’ EM country definition, are excluded.
The US Dollar Index measures the US dollar against six global currencies: the euro, Swiss franc, Japanese yen, Canadian dollar, British pound, and Swedish krona.
The FTSE Nareit All Equity REITs Index is a free-float adjusted, market capitalization-weighted index of U.S. equity REITs. Constituents of the index include all tax-qualified REITs with more than 50 percent of total assets in qualifying real estate assets other than mortgages secured by real property.
The S&P Global Listed Infrastructure index measures the performance of global companies that are engaged in infrastructure and related operations. It provides liquid and tradable exposure to 75 companies from around the world that represent the listed infrastructure universe. To create diversified exposure, the index includes three distinct infrastructure clusters: utilities, transportation and energy.
Brent crude is the most traded of all of the oil benchmarks, and is defined as crude mostly drilled from the North Sea oilfields: Brent, Forties, Oseberg and Ekofisk (collectively known as BFOE).
The Dow Jones Commodity Index Gold is designed to track the gold market through futures contracts.
The ICE BofA Option-Adjusted Spreads (OASs) are the calculated spreads between a computed OAS index of all bonds in a given rating category and a spot Treasury curve. An OAS index is constructed using each constituent bond’s OAS, weighted by market capitalization. The Corporate Master OAS uses an index of bonds that are considered investment grade (those rated BBB or better). When the last calendar day of the month takes place on the weekend, weekend observations will occur as a result of month ending accrued interest adjustments.
The ICE BofA Option-Adjusted Spreads (OASs) are the calculated spreads between a computed OAS index of all bonds in a given rating category and a spot Treasury curve. An OAS index is constructed using each constituent bond’s OAS, weighted by market capitalization. The ICE BofA High Yield Master II OAS uses an index of bonds that are below investment grade (those rated BB or below).
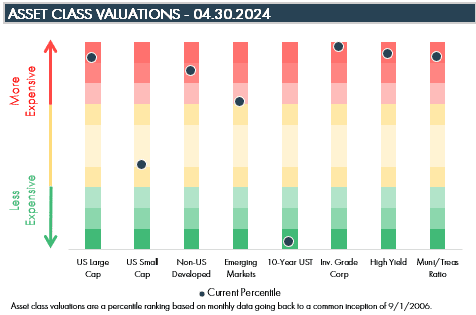
Asset class valuations are a percentile ranking based on monthly data going back to common inception of 9/1/2006. The US Large Cap percentile is the average percentile ranking of the trailing P/E, P/B, P/S, and P/C ratio of the S&P 500 Index. The US Small Cap percentile is the average percentile ranking of the trailing P/E, P/B, P/S, and P/C ratio of the Russell 2000 Index. The International Developed percentile is the average percentile ranking of the trailing P/E, P/B, P/S, and P/C ratio of the MSCI EAFE NR Index. The Emerging Market percentile is the average percentile ranking of the trailing P/E, P/B, P/S, and P/C ratio of the MSCI Emerging Markets NR Index. The 10-Year US Treasury percentile is the percentile ranking of the 10-Year US Treasury yield. The Investment Grade percentile is the percentile ranking of the ICE BofA US Corporate option adjusted spread. The High Yield Corporate percentile is the percentile ranking of the ICE BofA US High Yield corporate option adjusted spread. The Municipal/Treasury percentile is the percentile ranking of the Bloomberg Municipal Index yield divided by the 10-Year US Treasury Yield.