Chris Kamykowski, CFA, CFP® – Head of Investment Strategy and Research
Tim Side, CFA – Investment Strategist
Many college basketball fans are knee deep into the most recent edition of college basketball’s annual March Madness tournament. Passions can run far and wide as fans enthusiastically support their team’s winning ways throughout the tournament or face the stiff reality-check and severe disappointment when their team’s run ends. Hope springs eternal throughout the tournament for the “one shining moment” (or two, or three) to see their team (or betting pick) through. During this season ending drama, fan sentiment about a team, a player or a coach can swing violently even during a single game as momentum switches between opponents until the final whistle is blown.
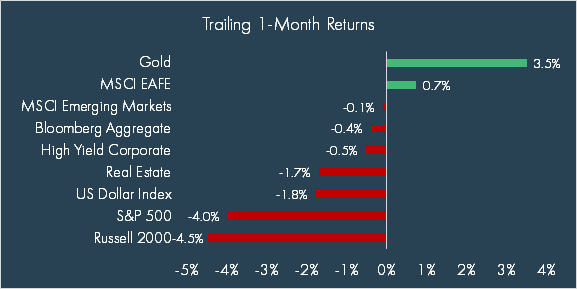
Investors are also in the midst of their own “March Madness” as uncertainty regarding the Trump administration’s policy actions has sent sentiment downward and certainty into a state of disarray. Markets have reflected both winners (non-US equities) and losers (US equities) as the potential impacts from immigration control, government audits, evolving tariff actions and policy, revamp of the global security apparatus, etc. create unexpected twists and turns to the once dominant theme of US exceptionalism.
It is easy to understand why various sentiment measures are showing steep declines similar to recent market declines in US equity markets. Momentum for now seems to have shifted away from the US and the outlook has become a bit dour with recession concerns back in focus. However, like in any basketball game, calling the game “lost” can be premature especially when hard data underneath still provides reasonable glimmers of hope for continued economic strength.
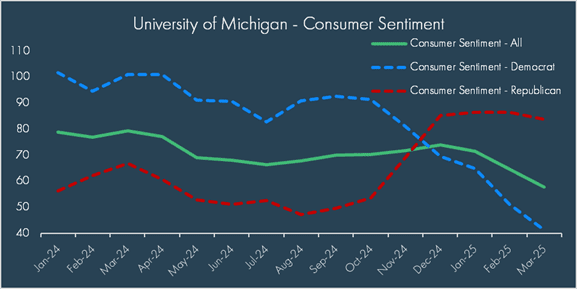
On the sentiment front, the University of Michigan Consumer Sentiment Index, a mainstream sentiment indicator, has recently gained press as its measures of consumer sentiment and expectations have fallen sharply in 2025. As with any indicator, the details matter as there is a noticeable divergence in sentiment based on political party affiliation.
Further consternation came from this week’s Conference Board’s Expectations Index (consumers’ short-term outlook for income, business, and labor market conditions), which dropped to its lowest level in 12 years, exceeding its pandemic low. The details of the survey suggest that consumers are more cautious about their purchasing plans for big-ticket items (homes and cars), but the intention to purchase additional services was little changed. The sharp drop in consumer expectation aligns with the recent deterioration in survey-based data amid anxiety around policy and recession risks. Additionally, investors have unsurprisingly expressed increasingly negative sentiment alongside market declines as seen in the AAII US Investors survey on stock market expectations over the next six months where bearish sentiment has jumped to levels last seen during the height of inflation concerns in 2022.
Sentiment, however, is a fickle thing…..much like a fan’s enthusiasm, or lack thereof, during various phases of a basketball game; when your team is winning, all things look rosy; vice versa for when your team is losing.
Like overall team head-to-head statistics (law of averages in basketball, for instance), hard economic data does matter when trying to assess whether sentiment is appropriately informed or just reactive to recent bouts of short-term hardship or uncertainty. This doesn’t discount concerns over ever-changing policy actions that have clouded what were once rosy outlooks at the beginning of the year. However, even amid declining sentiment, there are still reasons to believe the holistic picture for the economy remains on better footing than consumer survey or investor sentiment measures reflect. Here are some charts illustrating how hard data is holding steady, followed by a broader list of indicators reflecting continued durability.
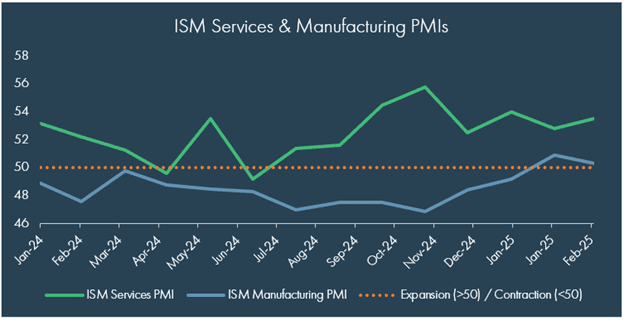
- ISM PMIs: Expansion remains in the cards for both services and manufacturing indices. Even as new orders face pressure due to tariff uncertainty, manufacturing is holding higher after 26 straight months of contraction.
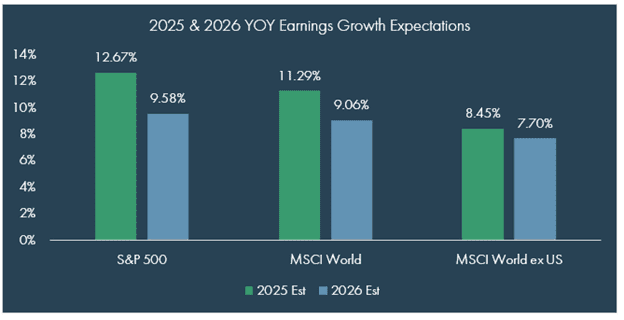
- Earnings Expectations: For all the consternation over stock market declines, earning expectations have not shifted materially lower for the US, which continues to maintain a global advantage for earnings growth expectations in 2025 and 2026.
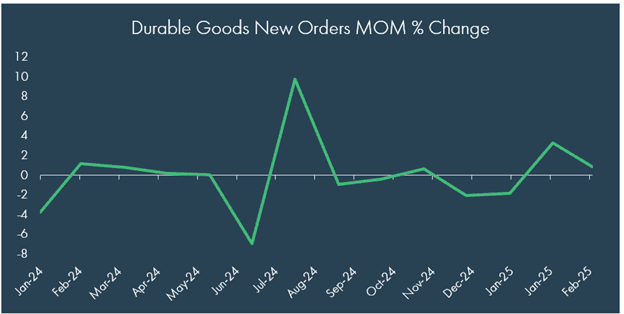
- Durable Goods Orders: With tariffs top of mind for companies and consumers, durable goods orders were still up for the second consecutive month in February, increasing 0.9% month-over-month.
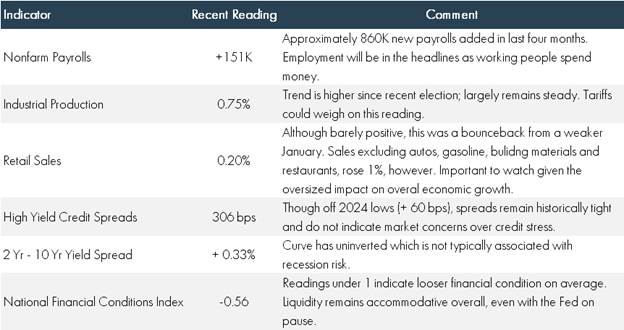
In addition to the previous select economic readings, there are other measures to be aware of that, while not painting a picture of above trend, expansionary growth, they still indicate a situation soft-landing, at minimum.
Fans and investors have a right to express dismay when their “team” of choice appears to be going through a losing run. Angst over a shrinking lead is natural, but a strong team can pull itself back after missing several shots in a row, making it prudent to look beyond emotions and observe the overall fundamentals of the team and economy.
So, is the recent selloff something the market can come back from? Well, looking at the data, it may just depend on “events, my dear boy, events”.[1] How far the administration takes the trade uncertainty, and how much investor discomfort can stretch before negative expectations become a self-fulfilling prophecy, remains to be seen. It’s worth noting that markets are expecting more clarity next week as Trump is expected to announce reciprocal tariffs on April 2nd.
We’ll be back next week with an update on trade, but in the meantime, as you watch markets churn and wonder if it’s a sign of an impending recession, we’ll leave you with a quote attributed to the famed economist, Paul Samuelson from 1966: “… stock prices do show more ups and downs than gross national product or business indicators generally. To prove that Wall Street is an early omen of movements still to come in GNP, commentators quote economic studies alleging that market downturns predicted four out of the last five recessions. That is an understatement. Wall Street indexes predicted nine out of the last five recessions! And its mistakes were beauties.”
[1] A quote commonly attributed to UK Prime Minister Harold Macmillian when asked what the most troubling problem of his Prime Ministership was.
DISCLOSURES
© 2025 Advisory services offered by Moneta Group Investment Advisors, LLC, (“MGIA”) an investment adviser registered with the Securities and Exchange Commission (“SEC”). MGIA is a wholly owned subsidiary of Moneta Group, LLC. Registration as an investment adviser does not imply a certain level of skill or training. The information contained herein is for informational purposes only, is not intended to be comprehensive or exclusive, and is based on materials deemed reliable, but the accuracy of which has not been verified.
Trademarks and copyrights of materials referenced herein are the property of their respective owners. Index returns reflect total return, assuming reinvestment of dividends and interest. The returns do not reflect the effect of taxes and/or fees that an investor would incur. Examples contained herein are for illustrative purposes only based on generic assumptions. Given the dynamic nature of the subject matter and the environment in which this communication was written, the information contained herein is subject to change. This is not an offer to sell or buy securities, nor does it represent any specific recommendation. You should consult with an appropriately credentialed professional before making any financial, investment, tax or legal decision. An index is an unmanaged portfolio of specified securities and does not reflect any initial or ongoing expenses nor can it be invested in directly. Past performance is not indicative of future returns. All investments are subject to a risk of loss. Diversification and strategic asset allocation do not assure profit or protect against loss in declining markets. These materials do not take into consideration your personal circumstances, financial or otherwise.
DEFINITIONS
The S&P 500 Index is a free-float capitalization-weighted index of the prices of approximately 500 large-cap common stocks actively traded in the United States.
The Russell 2000® Index is an index of 2000 issues representative of the U.S. small capitalization securities market.
The MSCI EAFE Index is a free float-adjusted market capitalization index designed to measure the equity market performance of developed markets, excluding the U.S. and Canada.
The MSCI Emerging Markets Index is a float-adjusted market capitalization index that consists of indices in 21 emerging economies.
The Bloomberg U.S. Aggregate Bond Index is an index, with income reinvested, generally representative of intermediate-term government bonds, investment grade corporate debt securities and mortgage-backed securities.
The Bloomberg US Corporate High Yield Bond Index measures the USD-denominated, high yield, fixed-rate corporate bond market. Securities are classified as high yield if the middle rating of Moody’s, Fitch and S&P is Ba1/BB+/BB+ or below. Bonds from issuers with an emerging markets country of risk, based on the indices’ EM country definition, are excluded.
The US Dollar Index measures the US dollar against six global currencies: the euro, Swiss franc, Japanese yen, Canadian dollar, British pound, and Swedish krona.
The FTSE Nareit All Equity REITs Index is a free-float adjusted, market capitalization-weighted index of U.S. equity REITs. Constituents of the index include all tax-qualified REITs with more than 50 percent of total assets in qualifying real estate assets other than mortgages secured by real property.
The Dow Jones Commodity Index Gold is designed to track the gold market through futures contracts.