Executive Summary
2025 served as another reminder of markets’ ability to climb the so-called “Wall of Worry”. The year carried its fair share of headline risks: a reordering of global defense philosophies, tariff disruptions, a near bear-market drawdown, a government shutdown, Middle East conflict, a tenuously stable labor market, and threats to Federal Reserve independence. Yet, despite these challenges, economic growth remained intact and the S&P 500 gained nearly 18%, marking the third consecutive year of double-digit gains, a historical rarity. Beneath the ample (and typical) noise, resilience defined the quarter and the year.
Economic Update
Another relatively strong year for U.S. growth is in the books. Real GDP expanded at a steady pace through 2025, with expectations pointing to continued growth into 2026, supported by easing financial conditions, AI-related capital expenditures, a resilient consumer, and tax-related fiscal support.
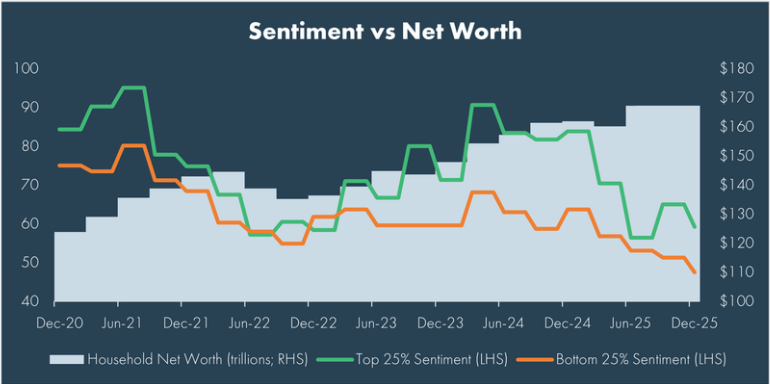
Despite the strength, a clear disconnect once again emerged between how households felt and how they behaved. Confidence measures weakened across income cohorts, while spending held up, highlighting the growing tension between inflation fatigue and real economic momentum. This divergence reflects less concern about job security or market performance (though those are certainly important) and more frustration with the absolute cost of living. Since 2019, essential expenses including energy, food, shelter, and utilities have risen roughly 30%, bringing affordability into sharper focus even as inflation readings moderate.
Tariffs remained a source of uncertainty heading into year-end. While early concerns around inflation and employment impacts proved less severe than feared, the burden of tariffs continues to shift. By late 2025, consumers were estimated to bear more than half of tariff-related costs, with that share expected to rise further in 2026. At the same time, bilateral trade agreements and supply chain adjustments suggest tariffs are unlikely to return to pre-2025 extremes, muting some of the more dire outcomes initially feared.

As the year progressed, policy attention turned to leadership at the Federal Reserve. With Jerome Powell’s term ending in May 2026, markets began pricing in not just the path of rates, but the implications of a new Fed Chair. The nomination process carries unusual significance given concerns around political influence and the Fed’s independence. While the outcome remains uncertain, expectations for monetary policy have stabilized, with markets pricing in two to three additional rate cuts in 2026 as the Fed shifts its focus toward downside labor market risks rather than upside inflation pressure.
Geopolitics added another layer of complexity. Ongoing conflict in Ukraine, the U.S. bombing of Iranian nuclear facilities, and China’s military drills near Taiwan generated headlines, though markets largely looked through the immediate shocks. Oil prices remained contained, and risk assets continued to advance, underscoring how geopolitical events often influence volatility more than long-term growth trajectories. Geopolitical complexity is likely to persist. Already, we’ve seen discussions of potential political changes in Venezuela in 2026, though the outcome remains uncertain. Long-term growth of wealth is often made from a disciplined process. Permanent impairment of capital can occur when we panic and make sub-optimal decisions based on fear.
Markets
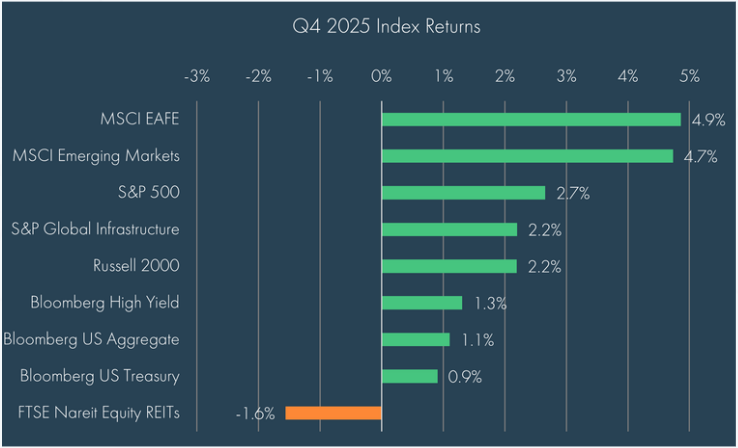
Markets delivered strong and broad-based returns in the fourth quarter. Non-U.S. equities outperformed over the quarter, which is notable given a marginally stronger dollar (+0.5%) and weaker performance from China (-7%). Emerging markets outperformed from continued strength in South Korea, which has benefited from a high degree of concentration in Samsung and SK Hynix over the year. Bonds continued to clip their coupon, picking up a bit of appreciation as yields inside of 10 years were mostly flat to lower. The Federal Reserve cut rates in October and December, bringing total easing for the year to 75 basis points. Listed Real Assets was the one area of mixed performance, with Infrastructure gaining more than 2% while Real Estate fell, primarily on weakness in the healthcare space (nursing homes) and offices.
For 2025, the S&P 500 finished the year up approximately 18%, while non-U.S. equities outpaced U.S. markets. The outperformance was broad as developed international equities gained over 30% for the year and emerging markets rose more than 33%; Bloomberg analysts estimate that 72% of non-U.S. ETFs outperformed the S&P 500 for the year. A weaker dollar over the first half of the year and improving global growth expectations helped drive this leadership shift, though there was notable improvement in non-U.S. fundamentals in the second half of the year even as the dollar stabilized.
The year has proven a point that seems many had forgotten, which is that international stocks can run without dethroning U.S. leadership. The U.S. has by no means been abandoned; success has just broadened. This is reinforced by ETF flows, which showed the U.S. capturing roughly 62% of global ETF flows this year, down from 2024’s 70%, but still strong and roughly in line with MSCI’s ACWI Index exposure.
Within the U.S., equity leadership evolved over the year. Large-cap equities remained resilient, but small caps surged following the April selloff, gaining more than 40% from the lows. That rally, however, was concentrated in lower-quality names, with the Russell 2000 significantly outpacing the higher-quality S&P 600.
Real assets produced mixed results. Infrastructure delivered strong double-digit returns, supported by structural demand tied to data centers, energy transition, and modernization. REITs lagged, pressured by higher long-term rates and sector-specific challenges, including overcapacity in certain residential markets.
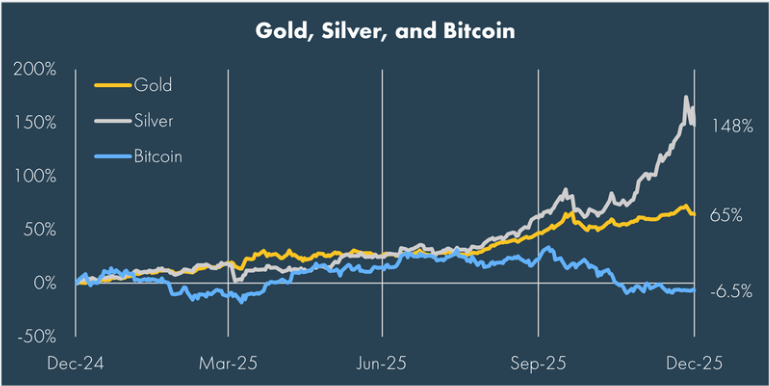
Commodities appeared to play an important role during the period with notable interest in gold and silver. Gold’s safe haven status and central bank purchases provided a strong tailwind that was accelerated by retail purchases. Over the year, gold ETFs saw net flows exceed $40 billion. Over the quarter, silver shone brightest though, reiterating its status as gold’s riskier (and perhaps undervalued) counterpart by gaining more than 50% over the quarter and nearly 150% over the year. On the flip side, we saw Bitcoin, an asset that is often floated as a safe haven asset, behave much more like a volatile risk asset, falling more than 30% from its all-time high as the broader crypto industry remains challenged following the liquidity crunch in October.
Over the year, fixed income asserted its role as a stabilizer, most notably during April’s selloff. Treasury yields declined modestly overall, with the curve steepening as long-term rates remained influenced by fiscal concerns and a higher term premium. Credit markets remained healthy, with low default rates in high yield bonds and only modest stress in leveraged loans tied to shorter maturity pressures amidst the higher rate environment. Municipal bonds continued to offer attractive tax-adjusted yields, though credit selection became more important amid localized policy developments.
Across asset classes, diversification once again proved its value. While the S&P 500 delivered another strong year, leadership rotated beyond U.S. large cap stocks. Portfolios built for balance and resilience captured gains while mitigating volatility during periods of stress.
Summary
As we close the books on 2025, the dominant lesson for 2026 is not about prediction, but preparation. Markets navigated extraordinary policy shifts, geopolitical events, and persistent uncertainty – yet growth held, earnings improved, and diversification was rewarded. The tension between strong fundamentals and uneasy sentiment is likely to persist in 2026, particularly as affordability pressures, political transitions, and global risks remain in focus.
Looking ahead, expectations for moderate growth, contained inflation, and gradual monetary easing provide a constructive backdrop, even as uncertainty around elections and policy decisions remains. In this environment, the discipline that carried portfolios through 2025 remains the anchor: high-quality equities, core fixed income, thoughtful diversification, and patient rebalancing.
Markets may continue to react loudly to headlines. Long-term outcomes, however, are shaped by staying invested, maintaining perspective, and resisting the temptation to chase or flee based on short-term narratives. Portfolios are built for resilience, not perfection; an approach that continues to matter most as the new year unfolds.
Disclosures
© 2026 Advisory services offered by Moneta Group Investment Advisors, LLC, (“MGIA”) an investment adviser registered with the Securities and Exchange Commission (“SEC”). MGIA is a wholly owned subsidiary of Moneta Group, LLC. Registration as an investment adviser does not imply a certain level of skill or training. The information contained herein is for informational purposes only, is not intended to be comprehensive or exclusive, and is based on materials deemed reliable, but the accuracy of which has not been verified.
Trademarks and copyrights of materials referenced herein are the property of their respective owners. Index returns reflect total return, assuming reinvestment of dividends and interest. The returns do not reflect the effect of taxes and/or fees that an investor would incur. Examples contained herein are for illustrative purposes only based on generic assumptions. Given the dynamic nature of the subject matter and the environment in which this communication was written, the information contained herein is subject to change. This is not an offer to sell or buy securities, nor does it represent any specific recommendation. You should consult with an appropriately credentialed professional before making any financial, investment, tax or legal decision. An index is an unmanaged portfolio of specified securities and does not reflect any initial or ongoing expenses nor can it be invested in directly. Past performance is not indicative of future returns. All investments are subject to a risk of loss. Diversification and strategic asset allocation do not assure profit or protect against loss in declining markets. These materials do not take into consideration your personal circumstances, financial or otherwise.
Definitions
The S&P 500 Index is a free-float capitalization-weighted index of the prices of approximately 500 large-cap common stocks actively traded in the United States.
The Russell 2000® Index is an index of 2000 issues representative of the U.S. small capitalization securities market.
The MSCI EAFE Index is a free float-adjusted market capitalization index designed to measure the equity market performance of developed markets, excluding the U.S. and Canada.
The MSCI Emerging Markets Index is a float-adjusted market capitalization index that consists of indices in 21 emerging economies.
Bloomberg U.S. Treasury Bond Index includes public obligations of the US Treasury, i.e. US government bonds. Certain Treasury bills are excluded by a maturity constraint. In addition, certain special issues, such as state and local government series bonds (SLGs), as well as U.S. Treasury TIPS, are excluded.
The Bloomberg U.S. Aggregate Bond Index is an index, with income reinvested, generally representative of intermediate-term government bonds, investment grade corporate debt securities and mortgage-backed securities.
The Bloomberg US Corporate High Yield Bond Index measures the USD-denominated, high yield, fixed-rate corporate bond market. Securities are classified as high yield if the middle rating of Moody’s, Fitch and S&P is Ba1/BB+/BB+ or below. Bonds from issuers with an emerging markets country of risk, based on the indices’ EM country definition, are excluded.
The FTSE Nareit All Equity REITs Index is a free-float adjusted, market capitalization-weighted index of U.S. equity REITs. Constituents of the index include all tax-qualified REITs with more than 50 percent of total assets in qualifying real estate assets other than mortgages secured by real property.
The S&P Global Listed Infrastructure Index measures the performance of global companies that are engaged in infrastructure and related operations. It provides liquid and tradable exposure to 75 companies from around the world that represent the listed infrastructure universe. To create diversified exposure, the index includes three distinct infrastructure clusters: utilities, transportation and energy.