Following 2023’s sweeping comeback performance, 2024 wanted a piece of the action. It was a quarter of warm springs and chill winds from the Middle East and Russia/Ukraine. Japan continued to rise, while China continued to present a muddied picture. All eyes remained on AI and its ramifications, while economic strength was the gift that kept giving. All the while, politics remained front and center as the election primary season churned in the US.
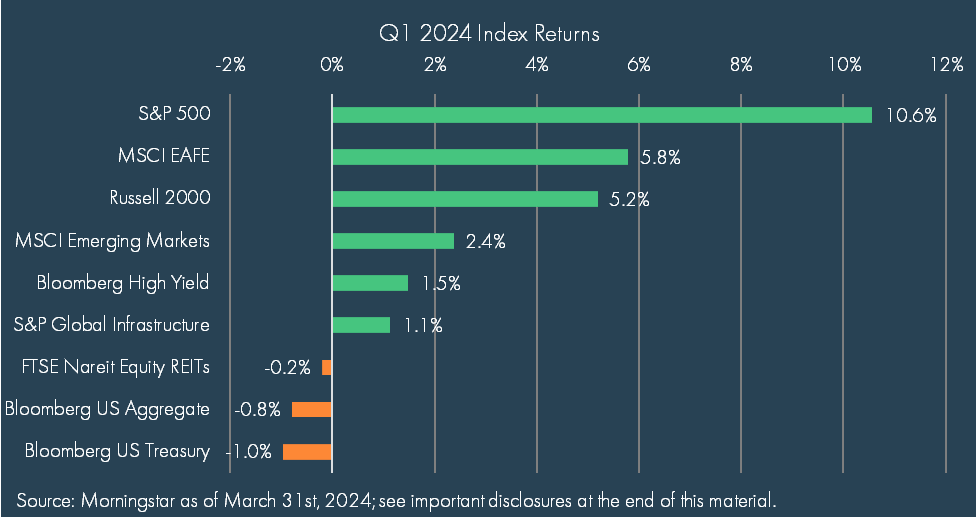
The first quarter of 2024 represented the second consecutive +10% quarter in the S&P since the first quarter of 2012, with the index breaking through the psychological 5,000 barrier in February. Other indices were similarly strong, but the US led the charge globally, handily outperforming most global indices – with notable exceptions by Japan and Taiwan. The dominance of US equities continues to push its share of the global market higher, with the US now representing nearly 64% of global equity markets at the end of Q1.
The individual stock stories have become fodder for media exuberance – particularly Nvidia, which is up 82% year-to-date with a market cap exceeding $2 trillion at the end of March 2024. Meanwhile some of the other Magnificent 7 names fell down to earth over the quarter, led by Apple (-11%) and Tesla (-29%), while Alphabet and Microsoft were more subdued than the rest of the pack at +8% and +12% year-to-date. The likely impact of AI on companies and business models continues to be at the forefront of earnings calls, although the full scope of the disruptive impact across different industries is by no means clear.
Confidence grew that inflation was continuing its downward trajectory, although there was some concern that it was stuck in the 3% lane and a nagging discomfort with the ongoing pressure of energy and food prices – which are not included in “core” inflation.
Ongoing strong economic data in the form of blowout jobs numbers month to month and strong GDP growth matched robust and improving corporate earnings. The strength of both moving the discussion from a “soft landing” to a “no landing” scenario as the economy seemed to be in firm recovery mode.
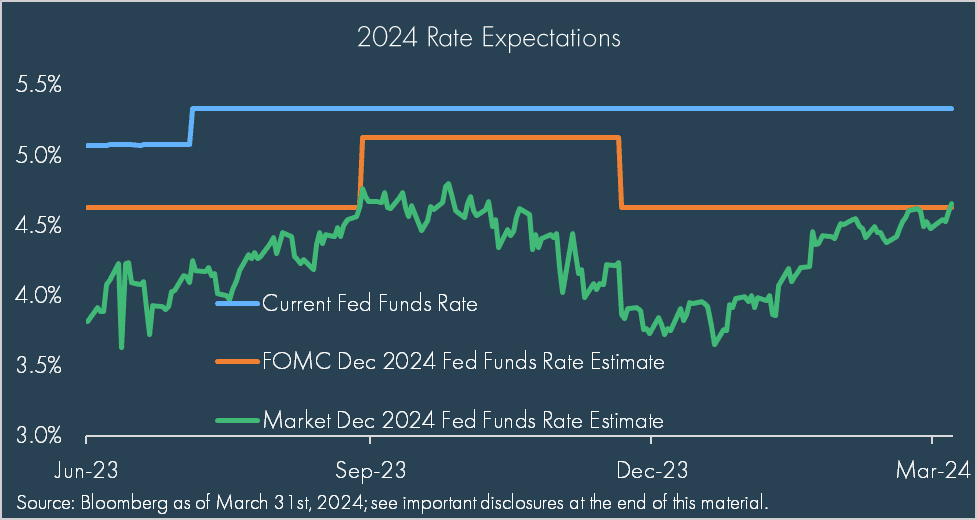
In light of this, it was surprising that expectations around rate cuts coalesced so significantly. The Fed reined in its hawkish rhetoric and committed to being “data dependent” as it expressed some satisfaction with the pathway of inflation and paused on rate hikes, biding its time before a cut though still calling for 2-3 cuts in 2024. The number of cuts expected by markets in 2024 compressed markedly as data surprised to the upside and inflation continued to be a wild card. Indeed, the most recent inflation print for March underscored the challenge of predicting inflation, much less bringing it under control. As we write, consensus estimates call for less than two rate cuts this year, down from the six cuts expected at the end of the year.
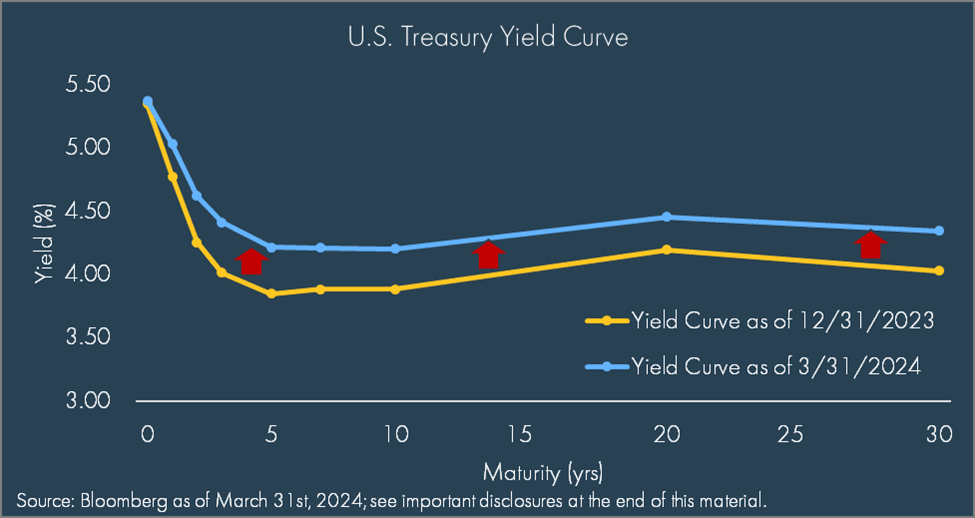
Bond markets reacted to the reset in rate expectations, with yields on the 10-year US Treasury rising more than 30 basis points over the quarter. A trend that has continued into the second quarter thus far.
Despite the rise in rates, volatility within fixed income has been more subdued and the tighter spreads around so-called riskier credit, such as lower rated corporate debt and high yield credit, suggests that investors are not particularly concerned about credit quality. Outside public fixed income, re-financing has been picking up and the demand for borrowing in the private market has remained strong.
Within other asset classes, gold and Bitcoin both experienced strong rallies over the quarter as gold added 8% to reach a record high of over $2,200 per ounce while Bitcoin was boosted by the launch of dedicated ETFs and the upcoming “halving event” – an element we discussed in more depth here – finishing the quarter just over $70,000.
Looking to the rest of the year, it is hard to escape the rumblings of both domestic and global politics as battle lines are drawn in the upcoming presidential election, which could be the first rematch between former presidents since 1956. Bumps in the road are to be expected for any investor, but nonetheless, the engine of the US economy – driven by a resilient, if not stretched, consumer – continues to plug along with expectations of 2-3% real US GDP growth and S&P 500 earnings growth of more than 6% in 2024. Any injection of uncertainty tends to be unwelcome and geopolitics could well have domestic collateral damage, yet over time fundamentals, not politics, drive markets irrespective of the party in power.
DISCLOSURES
© 2024 Advisory services offered by Moneta Group Investment Advisors, LLC, (“MGIA”) an investment adviser registered with the Securities and Exchange Commission (“SEC”). MGIA is a wholly owned subsidiary of Moneta Group, LLC. Registration as an investment adviser does not imply a certain level of skill or training. The information contained herein is for informational purposes only, is not intended to be comprehensive or exclusive, and is based on materials deemed reliable, but the accuracy of which has not been verified.
Trademarks and copyrights of materials referenced herein are the property of their respective owners. Index returns reflect total return, assuming reinvestment of dividends and interest. The returns do not reflect the effect of taxes and/or fees that an investor would incur. Examples contained herein are for illustrative purposes only based on generic assumptions. Given the dynamic nature of the subject matter and the environment in which this communication was written, the information contained herein is subject to change. This is not an offer to sell or buy securities, nor does it represent any specific recommendation. You should consult with an appropriately credentialed professional before making any financial, investment, tax or legal decision. An index is an unmanaged portfolio of specified securities and does not reflect any initial or ongoing expenses nor can it be invested in directly. Past performance is not indicative of future returns. All investments are subject to a risk of loss. Diversification and strategic asset allocation do not assure profit or protect against loss in declining markets. These materials do not take into consideration your personal circumstances, financial or otherwise.
DEFINITIONS
The Treasury yield is the effective annual interest rate that the U.S. government pays on its debt obligations, expressed as a percentage. Broadly, the Treasury yield is the annual return investors can expect from holding a U.S. government security with a given maturity. The U.S. Treasury yield curve refers to a line chart that depicts the yields of short-term Treasury bills compared to the yields of long-term Treasury notes and bonds. The Treasury yield curve (also referred to as the term structure of interest rates) shows yields at fixed maturities, such as one, two, three, and six months and one, two, three, five, seven, 10, 20, and 30 years. Because Treasury bills and bonds are resold daily on the secondary market, yields on the notes, bills, and bonds fluctuate.
The S&P 500 Index is a free-float capitalization-weighted index of the prices of approximately 500 large-cap common stocks actively traded in the United States.
The Russell 2000® Index is an index of 2000 issues representative of the U.S. small capitalization securities market.
The MSCI EAFE Index is a free float-adjusted market capitalization index designed to measure the equity market performance of developed markets, excluding the U.S. and Canada.
The MSCI Emerging Markets Index is a float-adjusted market capitalization index that consists of indices in 21 emerging economies.
Bloomberg U.S. Treasury Bond Index includes public obligations of the US Treasury, i.e. US government bonds. Certain Treasury bills are excluded by a maturity constraint. In addition, certain special issues, such as state and local government series bonds (SLGs), as well as U.S. Treasury TIPS, are excluded.
The Bloomberg U.S. Aggregate Bond Index is an index, with income reinvested, generally representative of intermediate-term government bonds, investment grade corporate debt securities and mortgage-backed securities.
The Bloomberg US Corporate High Yield Bond Index measures the USD-denominated, high yield, fixed-rate corporate bond market. Securities are classified as high yield if the middle rating of Moody’s, Fitch and S&P is Ba1/BB+/BB+ or below. Bonds from issuers with an emerging markets country of risk, based on the indices’ EM country definition, are excluded.
The FTSE Nareit All Equity REITs Index is a free-float adjusted, market capitalization-weighted index of U.S. equity REITs. Constituents of the index include all tax-qualified REITs with more than 50 percent of total assets in qualifying real estate assets other than mortgages secured by real property.
The S&P Global Listed Infrastructure index measures the performance of global companies that are engaged in infrastructure and related operations. It provides liquid and tradable exposure to 75 companies from around the world that represent the listed infrastructure universe. To create diversified exposure, the index includes three distinct infrastructure clusters: utilities, transportation and energy.
The Dot Plot is the Federal Open Market Committee (FOMC) participants’ assessments of appropriate monetary policy, summarized by the midpoint of target range or target level for the federal funds rate. Each participants’ assessment indicates the value (rounded to the nearest 1/8 percentage point) of an individual participant’s judgment of the midpoint of the appropriate target range for the federal funds rate or the appropriate target level for the federal funds rate at the end of the specified calendar year or over the longer run.
The effective Federal Funds rate (EFFR) is calculated as a volume-weighted median of overnight federal funds transactions reported in the FR 2420 Report of Selected Money Market Rates. The New York Fed publishes the EFFR for the prior business day on the New York Fed’s website at approximately 9:00 a.m. The federal funds market consists of domestic unsecured borrowings in U.S. dollars by depository institutions from other depository institutions and certain other entities, primarily government-sponsored enterprises.