Chris Kamykowski, CFA, CFP® – Head of Investment Strategy and Research
Early 2024 has seen all-time highs in the equity markets seem as frequent as Taylor Swift sightings at Kansas City Chiefs’ football games. Multiple new record highs by the S&P 500 have hit in quick succession with 13 between January 19th and February 23rd. Even non-US markets experienced new market tops with Europe’s Stoxx 600 hitting a record high and Japanese Nikkei 225 finally surpassing its peak set over 34 years ago. Both the S&P 500 and Stoxx 600 recorded their last record highs over two years ago in January 2022.
To be sure, the breadth of the S&P 500’s advance remains concentrated, with the top 10 stocks accounting for 65% of this year’s surge compared to 62% in 2023. US large-cap growth — led by Nvidia — continues to carry the load with a 9.6% return versus US large-cap value’s 2.9%, as of 2/26/2024.
Despite the concentration, a record is a record, and it leaves investors to question “What now?”. Before giving into the temptation to sell at the peak, does history argue for or against such a move? The answer may surprise investors.
Key to this question is defining what constitutes an all-time high (ATH) for the S&P 500. For this piece, we define an ATH as a new record that occurred at least twelve months since the previous ATH.
Using this definition and excluding the most recent period underway, 13 of the 14 ATHs occurring since 1954 experienced positive returns averaging 13% twelve months forward, with individual time period returns ranging from as low as 3.6% (1972) to as high as 41% (1954). The Global Financial Crisis took hold following the May 2007 ATH, creating the group’s outlier as markets were down -9.5% twelve months later.
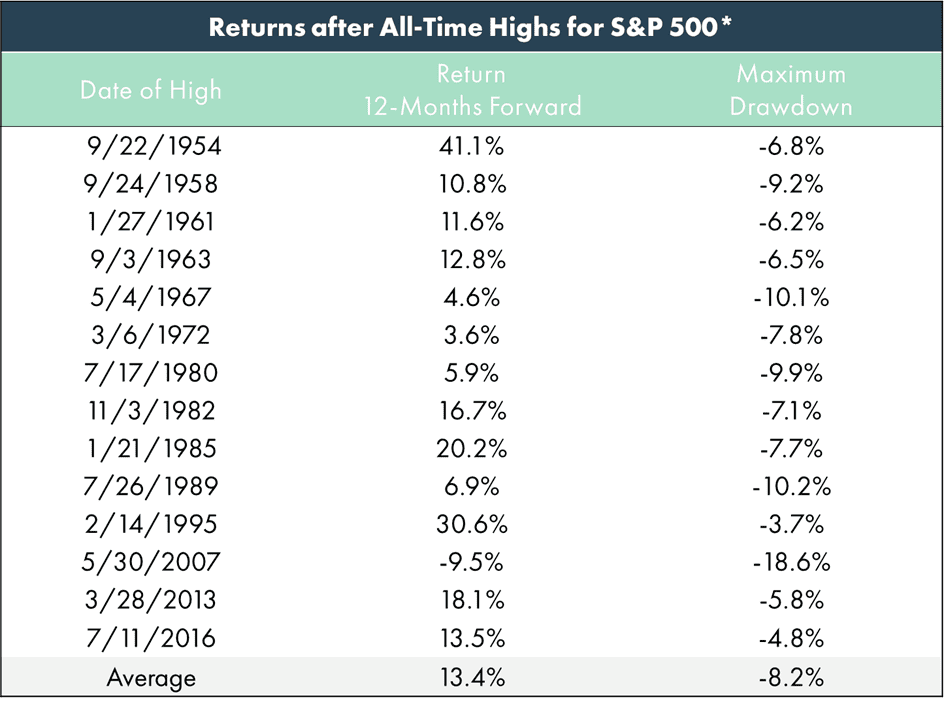
*All-time high marked after 12 months have passed since previous S&P 500 all-time high.
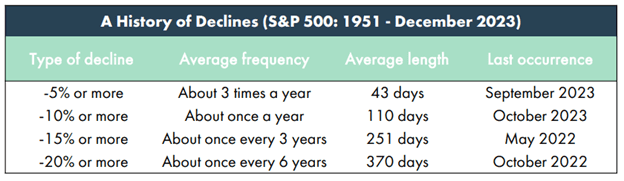
It is noteworthy that the S&P 500 did not simply keep ascending in any of the 13 positive periods following an ATH, as evidenced in the maximum drawdown column. Instead, markets experienced varying degrees of downside volatility (an ever-present investment risk), with an average maximum drawdown of -8.2%. This should be of no surprise based on historical statistics which show markets endure at least three 5% declines and at least one 10% drop in any given calendar year.
CONCLUSION
Whether it has been several years since the markets’ last all-time high or just a few days, records will come and go. As has been shown here, using a record close as a signal to trade out of the market could risk missing further upside in the following twelve months. Ultimately, days in the market matter much more than attempting to time investments, and history has shown that missing the single best-performing days substantially reduces annualized returns. Maintaining consistent investment in the markets — with rebalancing around one’s strategic asset allocation targets – enables long-term capital appreciation, mitigates the risks associated with trying to time market movements, and has proven more resilient and conducive to sustained growth over time.
Sources:
Morningstar
Bloomberg
Definitions
The S&P 500 PR Index is a free-float capitalization-weighted index of the prices of approximately 500 large-cap common stocks actively traded in the United States.
Disclaimer
© 2024 Advisory services offered by Moneta Group Investment Advisors, LLC, (“MGIA”) an investment adviser registered with the Securities and Exchange Commission (“SEC”). MGIA is a wholly owned subsidiary of Moneta Group, LLC. Registration as an investment advisor does not imply a certain level of skill or training. The information contained herein is for informational purposes only, is not intended to be comprehensive or exclusive, and is based on materials deemed reliable, but the accuracy of which has not been verified. Trademarks and copyrights of materials referenced herein are the property of their respective owners. Index returns reflect total return, assuming reinvestment of dividends and interest. The returns do not reflect the effect of taxes and/or fees that an investor would incur. Examples contained herein are for illustrative purposes only based on generic assumptions. Given the dynamic nature of the subject matter and the environment in which this communication was written, the information contained herein is subject to change. This is not an offer to sell or buy securities, nor does it represent any specific recommendation. You should consult with an appropriately credentialed professional before making any financial, investment, tax or legal decision. An index is an unmanaged portfolio of specified securities and does not reflect any initial or ongoing expenses nor can it be invested in directly. Past performance is not indicative of future returns. All investments are subject to a risk of loss. Diversification and strategic asset allocation do not assure profit or protect against loss in declining markets. These materials do not take into consideration your personal circumstances, financial or otherwise.