
March Observations
Geopolitics Trigger Sharp Global Selloff
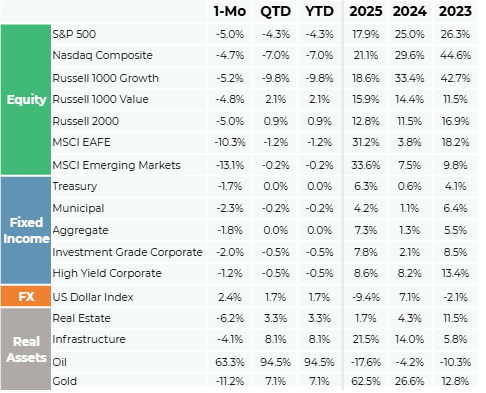
Global markets declined significantly in March amid the escalating conflict with Iran. U.S. equities fell broadly, with the S&P 500 and Russell 2000 indices both down 5.0%, while growth stocks lagged value. International markets saw even steeper losses, with MSCI EAFE dropping 10.3% and emerging markets falling 13.1%, led by sharp declines across Asia given its heavy reliance on the Persian Gulf for oil and gas. Fixed income offered limited diversification as 2-year Treasury yields rose 42 basis points and 10-year Treasury yields rose 38 basis points amid inflation concerns tied to surging oil prices. Commodities saw strong performance as oil prices rose above $118 per barrel due to supply disruptions, though gold gave back some gains, falling 11.2% over the month. Markets rebounded late in the month following signs of potential de-escalation, though uncertainty remains high as investors weigh the economic impact of sustained geopolitical tensions and elevated energy prices.
Heightened Focus on Energy Markets
The closure of the Strait of Hormuz, a critical chokepoint for multiple commodities, has sent shockwaves around the world. Prior to the closure, an estimated 20% of oil and liquefied natural gas (LNG) and a third of global fertilizer and essential raw materials, to name a few, passed through the strait. As expected, commodity prices rose significantly, though regional differences were noticeable as West Texas Intermediate (the U.S. benchmark) only rose 51% relative to Brent crude (global benchmark) which rose more than 60%.
Federal Reserve Holds Rates Steady
In an 11-1 vote, the FOMC held rates steady for the second consecutive meeting. Markets had priced in a hold, but stocks sold off sharply as the Fed Chair Powell emphasized how unpredictable the Iran situation is, even to the Fed. The natural inclination to treat the rise in oil prices as inflationary led markets to price in no Fed rate cuts in 2026 and a possible hike.
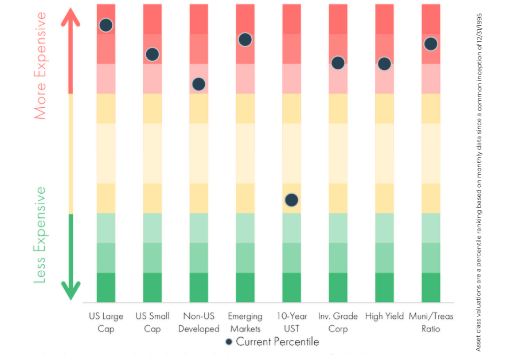
Asset Class Valuations – 3.31-2026
Asset Manager Commentary
Global Asset Manager
Global growth is being supported by AI-driven capital expenditures and easing monetary policy, despite ongoing volatility. Bond markets appear to be reacting rationally to a short-term energy shock, primarily impacting short rates. If inflation remains contained, central banks may be less likely to raise rates.
Emerging Markets Manager
China performed well in 2025, but concerns remain about potential government intervention and ongoing geopolitical tensions, especially with the U.S. There are signs the government may be easing control by allowing more private-sector participation and competition in capital allocation. Additionally, China appears increasingly concerned about lagging behind the U.S. in widespread AI adoption and innovation.
Private Capital Data Aggregator
The average bid for software loans has declined meaningfully this year, with the sector representing an estimated 13% of the private credit market. While non-software loans have also experienced declines, the impact has been less severe, highlighting uneven pressure across the asset class. Although the shakeout is ongoing, it appears unlikely to pose an existential threat to private credit.
Chart of the Month
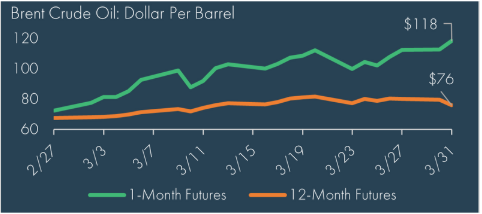
All eyes were on the price of oil over the month as the Strait of Hormuz closure disrupted ~20% of global supply (reducing supply by an estimated 11.1M barrels/day after offsets). However, lower prices 12 months out, as represented by 12-month futures contracts for Brent Crude, suggest markets expect the disruption to be temporary.
Disclosures
© 2026 Advisory services offered by Moneta Group Investment Advisors, LLC, (“MGIA”) an investment adviser registered with the Securities and Exchange Commission (“SEC”). MGIA is a wholly owned subsidiary of Moneta Group, LLC. Registration as an investment adviser does not imply a certain level of skill or training. The information contained herein is for informational purposes only, is not intended to be comprehensive or exclusive, and is based on materials deemed reliable, but the accuracy of which has not been verified.
Trademarks and copyrights of materials referenced herein are the property of their respective owners. Index returns reflect total return, assuming reinvestment of dividends and interest. The returns do not reflect the effect of taxes and/or fees that an investor would incur. Examples contained herein are for illustrative purposes only based on generic assumptions. Given the dynamic nature of the subject matter and the environment in which this communication was written, the information contained herein is subject to change. This is not an offer to sell or buy securities, nor does it represent any specific recommendation. You should consult with an appropriately credentialed professional before making any financial, investment, tax or legal decision. An index is an unmanaged portfolio of specified securities and does not reflect any initial or ongoing expenses nor can it be invested in directly. Past performance is not indicative of future returns. All investments are subject to a risk of loss. Diversification and strategic asset allocation do not assure profit or protect against loss in declining markets. These materials do not take into consideration your personal circumstances, financial or otherwise.
Sources
Morningstar Direct, Bloomberg as of 3/31/2026
Manager comments come from discussions with various asset managers and are broad commentary on sectors and not be considered recommendations by any asset manager. These comments do not necessarily reflect strategy allocations or the view or opinion of MGIA or Moneta Group .
Definitions
The S&P 500 Index is a free-float capitalization-weighted index of the prices of approximately 500 large-cap common stocks actively traded in the United States.
The NASDAQ Composite Index is a market capitalization weighted index with more than 3000 common equities listed on the NASDAQ Stock Market.
The NASDAQ 100 Index is a modified capitalization-weighted index of the 100 largest and most active non-financial domestic and international issues listed on the NASDAQ..
The Russell 1000® Index is an index of 1000 issues representative of the U.S. large capitalization securities market.
The Russell 1000® Growth Index measures the performance of the large-cap growth segment of the U.S. equity universe. It includes those Russell 1000 companies with higher price-to-book ratios and higher forecasted growth values.
The Russell 1000® Value Index measures the performance of those Russell 1000 Index securities with lower price-to-book ratios and lower forecasted growth values, representative of U.S. Securities exhibiting value characteristics.
The Russell 2000® Index is an index of 2000 issues representative of the U.S. small capitalization securities market.
The MSCI EAFE Index is a free float-adjusted market capitalization index designed to measure the equity market performance of developed markets, excluding the U.S. and Canada.
The MSCI Emerging Markets Index is a float-adjusted market capitalization index that consists of indices in 21 emerging economies.
Bloomberg U.S. Treasury Bond Index includes public obligations of the US Treasury, i.e. US government bonds. Certain Treasury bills are excluded by a maturity constraint. In addition, certain special issues, such as state and local government series bonds (SLGs), as well as U.S. Treasury TIPS, are excluded.
The Bloomberg U.S. Municipal Index covers the USD-denominated long-term tax exempt bond market. It includes general obligation and revenue bonds, which both can be pre-refunded years later and get reclassified as such.
The Bloomberg U.S. Aggregate Bond Index is an index, with income reinvested, generally representative of intermediate-term government bonds, investment grade corporate debt securities and mortgage-backed securities.
The Bloomberg US Corporate Bond Index measures the investment grade, fixed-rate, taxable corporate bond market. It includes USD-denominated securities publicly issued by US and non-US industrial, utility and financial issuers.
The Bloomberg US Corporate High Yield Bond Index measures the USD-denominated, high yield, fixed-rate corporate bond market. Securities are classified as high yield if the middle rating of Moody’s, Fitch and S&P is Ba1/BB+/BB+ or below. Bonds from issuers with an emerging markets country of risk, based on the indices’ EM country definition, are excluded.
The US Dollar Index measures the US dollar against six global currencies: the euro, Swiss franc, Japanese yen, Canadian dollar, British pound, and Swedish krona.
The FTSE Nareit All Equity REITs Index is a free-float adjusted, market capitalization-weighted index of U.S. equity REITs. Constituents of the index include all tax-qualified REITs with more than 50 percent of total assets in qualifying real estate assets other than mortgages secured by real property.
The S&P Global Listed Infrastructure Index measures the performance of global companies that are engaged in infrastructure and related operations. It provides liquid and tradable exposure to 75 companies from around the world that represent the listed infrastructure universe. To create diversified exposure, the index includes three distinct infrastructure clusters: utilities, transportation and energy.
Brent Crude is the most traded of all of the oil benchmarks, and is defined as crude mostly drilled from the North Sea oilfields: Brent, Forties, Oseberg and Ekofisk (collectively known as BFOE).
The Dow Jones Commodity Index Gold is designed to track the gold market through futures contracts.
The ICE BofA Option-Adjusted Spreads (OASs) are the calculated spreads between a computed OAS index of all bonds in a given rating category and a spot Treasury curve. An OAS index is constructed using each constituent bond’s OAS, weighted by market capitalization. The Corporate Master OAS uses an index of bonds that are considered investment grade (those rated BBB or better). When the last calendar day of the month takes place on the weekend, weekend observations will occur as a result of month ending accrued interest adjustments.
The ICE BofA Option-Adjusted Spreads (OASs) are the calculated spreads between a computed OAS index of all bonds in a given rating category and a spot Treasury curve. An OAS index is constructed using each constituent bond’s OAS, weighted by market capitalization. The ICE BofA High Yield Master II OAS uses an index of bonds that are below investment grade (those rated BB or below).
Asset class valuations are a percentile ranking based on monthly data going back to common inception of 12/31/1995. The US Large Cap percentile is the average percentile ranking of the trailing P/E, P/B, P/S, and P/C ratio of the S&P 500 Index. The US Small Cap percentile is the average percentile ranking of the trailing P/E, P/B, P/S, and P/C ratio of the Russell 2000 Index. The International Developed percentile is the average percentile ranking of the trailing P/E, P/B, P/S, and P/C ratio of the MSCI EAFE Index. The Emerging Market percentile is the average percentile ranking of the trailing P/E, P/B, P/S, and P/C ratio of the MSCI Emerging Markets Index. The 10-Year US Treasury percentile is the percentile ranking of the 10-Year US Treasury yield. The Investment Grade percentile is the percentile ranking of the ICE BofA US Corporate option adjusted spread. The High Yield Corporate percentile is the percentile ranking of the ICE BofA US High Yield corporate option adjusted spread. The Municipal/Treasury percentile is the percentile ranking of the Bloomberg Municipal Index yield divided by the 10-Year US Treasury Yield.