By Bill Hornbarger, Chief Investment Officer at Moneta
In recent weeks, the equity markets have buckled but not necessarily broken. The S&P 500 closed at an all-time high on July 26 before falling 6% over the next six trading sessions and then suffering several large down days so far in the month of August. Despite the increased volatility, the market (as measured by the S&P 500) currently sits approximately 3.3% (100 points) below its record closing level.
If the bull market climbs the proverbial wall of worry, there is currently plenty of fodder for the markets to reflect on. A few reasons investors might feel uneasy today include:
- The Treasury yield curve certainly has an odd shape with large portions of it inverted (short maturities yielding more than longer maturities). Most recently, the 2-year note inverted to the 10-year note, while other portions have been inverted since May.
- More than $16 trillion of global sovereign debt trades at negative yields. That is up from just $6 trillion less than 12 months ago. The U.S. 30-year Treasury bond recently touched a record low, trading below 2% on a yield basis.
- Trade wars are affecting global growth with tariffs and threats of tariffs and currency battles taking their toll on growth and confidence.
- The Federal Open Market Committee recently lowered interest rates for the first time in more than a decade and the President has publicly taken to social media to encourage more reductions in the target rate. Lower rates are usually in response to a slowing economy.
While all of these conditions are reasons to worry, the one that has most prominently captured investors’ attentions is the yield curve. The yield curve is a market-based indicator that represents, in real time, the collective thoughts of bond traders, portfolio managers and investors from all over the world. One theory is that inversion reflects future expectations of interest rates. An inversion indicates the markets believe yields will decline and the Fed will reduce short-term rates. An inversion is often (but not always) a predecessor to a recession. That has increased concerns for equity investors.
John Templeton once famously said, “The four most dangerous words in investing are: ‘This time it’s different.’” While we fundamentally believe this to be the case, it would be naïve to think that the extraordinary global monetary policy enacted over the past decade (0% interest rate policy and asset purchases) will not have unintended consequences – with an inverted yield curve potentially being among them.
What if the yield curve is correct and a recession is on the horizon? Research suggests it isn’t imminent and the equity markets still have room to the upside. According to an analysis by Credit Suisse, a recession has, on average, followed 22 months after an inversion of 2-year and 10-year Treasury yields. Moreover, markets can still produce positive returns for investors following a yield curve inversion. Since 1978, the S&P 500 has risen, on average, 13% between the inversion and the start of the recession, according to Dow Jones Market Data. Research by LPL Financial shows, in the case of the past five recessions, the S&P 500 Index did not peak until almost a year after the yield curve inversion, with a median gain of nearly 22%.
The aforementioned reasons for concern are just a handful of many. However, there are also numerous positives to consider, including historically low unemployment and interest rates, the fact that stocks often perform well heading into election years, amazingly robust earnings for tech companies, strong consumer spending and more. A few things that we suggest in this environment include:
- It’s not a matter of “if,” but “when” the next market decline and economic recession occurs.
- An abundance of research suggests market timing, including attempting to sell at the top and repurchase after a pullback, is a losing proposition.
- Can you think of a time when clarifying your risk and return objectives was more important than now?
- Can you think of a time when broad, thoughtful diversification was more important than now?
Given the length of this economic expansion and lofty returns for stocks, investors could be feeling good – but it’s understandable that most feel a bit uneasy. None of us will precisely predict the next downturn. Stocks may forge ahead for some time. The prudent approach would be to, in almost clinical fashion, examine your investment strategy and ensure it aligns with your specific objectives and goals.

FIXED INCOME
- U.S. Treasury yields fell on the short end of the curve with the 3-month rate finishing at 2.08%, while the belly of the curve climbed with the 10-year, ending the month at 2.02%. The yield curve remained inverted but has flattened since June.
- All domestic fixed income sectors posted positive returns as expectations were confirmed that the Federal Reserve would lower interest rates.
- International developed bond markets fell as a result of currency fluctuations. Emerging markets debt increased in value despite a strong U.S. Dollar as a result of central bank interest rate reductions globally.
EQUITIES
- Domestic equities surpassed previous highs led by better-than-expected earnings growth, increased expectations of interest rate declines and the restart of U.S.-China trade discussions.
- Growth broadly outperformed value during the month. Information technology, communication services and consumer staples led while energy, materials and industrials lagged the benchmark.
- International equities fell on concerns over a potential no-deal Brexit and trade tensions. Emerging markets fell on U.S. Dollar strength and trade concerns.
REAL ASSETS
- Commodity prices fell slightly, dragged lower by natural gas despite gains made by precious metals on expectations of interest rate cuts.
- Domestic and international REITs generated modest returns influenced by falling interest rate expectations.
- The energy sector’s Master Limited Partnerships (MLPs) underperformed despite a rally in oil prices as investors grew weary of natural gas losses due to oversupply.
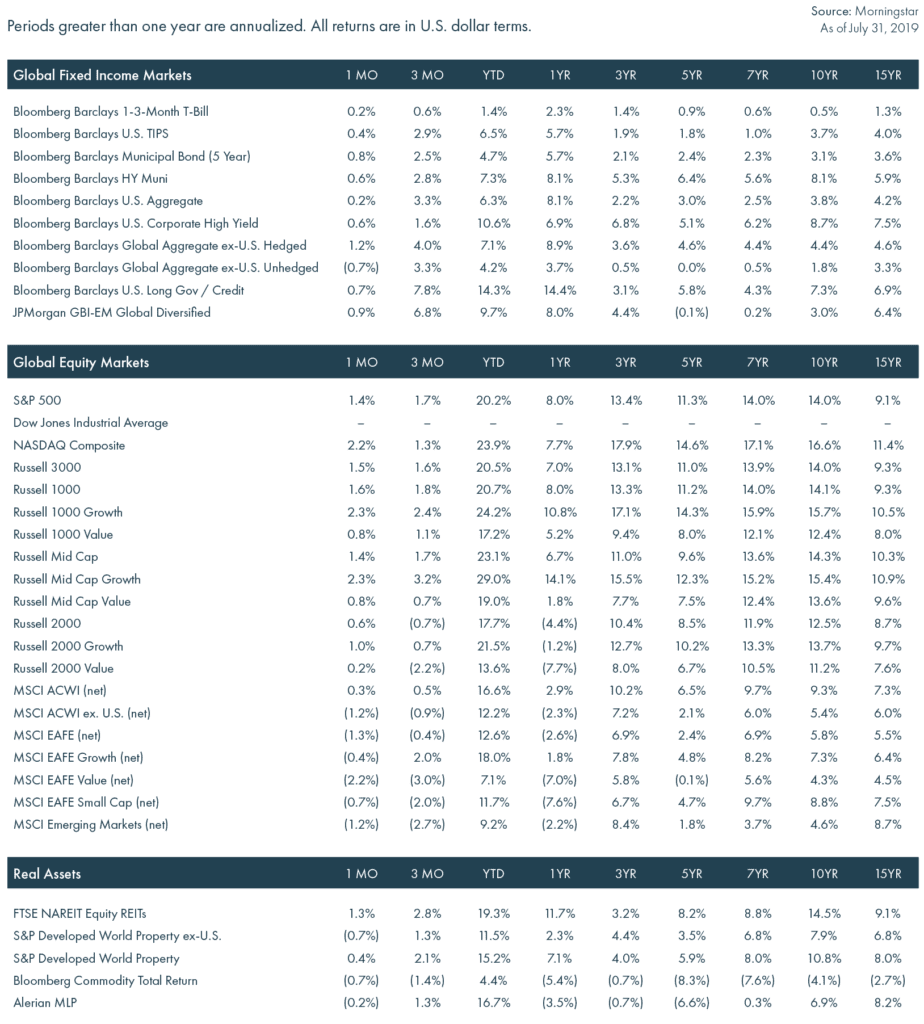
Financial Markets Performance
Total returns as of July 31, 2019
© 2019 Moneta Group Investment Advisors, LLC. All rights reserved. These materials were prepared for informational purposes only. You should consult with an appropriately credentialed professional before making any financial, investment, tax or legal decision. Past performance is not indicative of future returns. These materials do not take into consideration your personal circumstances, financial or otherwise.