With the holiday season upon us and decorations lining the streets, two colors seem to be ubiquitous: red and green. In the investment world, when looking at a color-coded return table or heat map, green often represents a positive return while red signals a negative return. This year, red will likely be the most prominent color when looking at a list of asset-class returns.
Slow Burn, Slow Recovery
The muted or negative returns this year might not have felt as impactful as prior negative periods for a few reasons. The U.S. equity market began to recover after a drawdown in the first quarter of 2018, but U.S. equity indices fell again in October, rallied and fell again in November, and rallied and fell again in early December. International and emerging markets have not recovered from a similar first-quarter drawdown and have continued to slide lower, but the pace has been gradual rather than sudden. U.S. fixed income markets have slipped but to a lesser degree than equities—as should be expected based on volatility and risk assumptions for the asset class.
The Bloomberg Barclays U.S. Aggregate Bond Index is on track to finish the calendar year with a negative return for the first time since the “Taper Tantrum” of 2013, when U.S. yields rose on news that the U.S. Federal Reserve (the Fed) would be scaling down its bond-buying program. Corporate bond credit spreads have widened, but also at a moderate rather than rapid pace. In many of these markets, the losses have been more of a slow burn rather than a massive spike downward over a short period of time (Display).
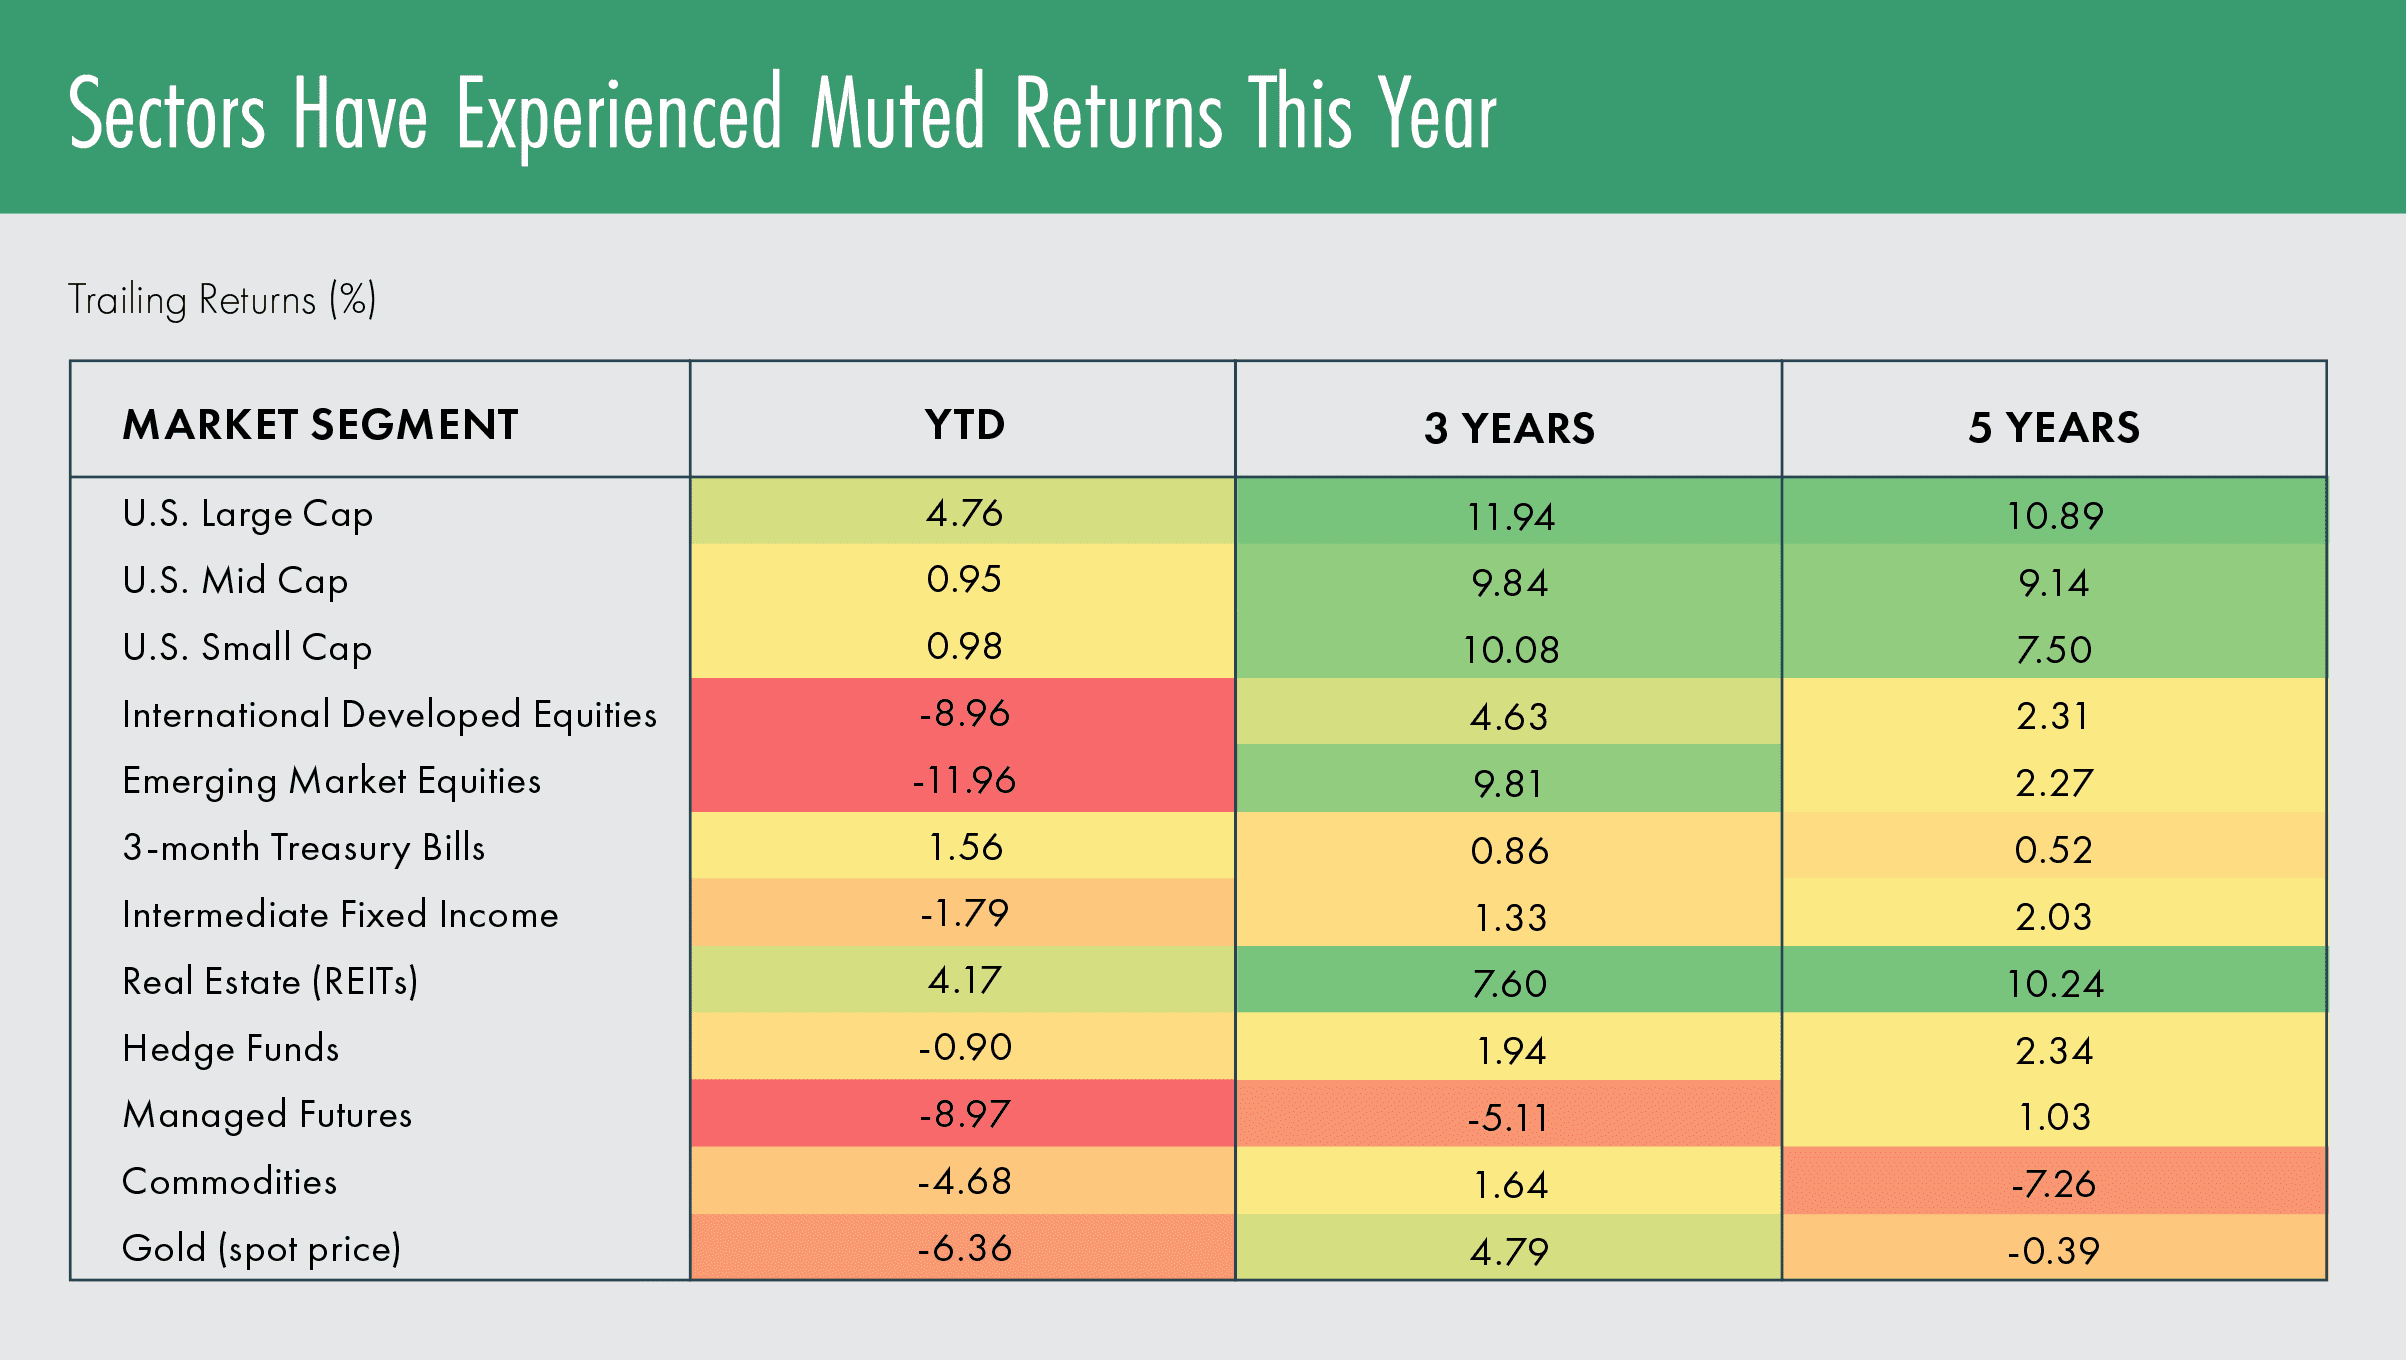
Sources: Morningstar, Bloomberg. Annualized if greater than 1 year. Market segments shown are represented by the following indices: U.S. = Russell, International & Emerging = MSCI, 3-month Treasury Bills = USTREAS, Intermediate Fixed Income = Bloomberg Barclays, REITs = FTSE NAREIT, Hedge Funds = HFRI, Managed Futures = SocGen, Commodities = Bloomberg, Gold = S&P.
As of November 30, 2018
Performance Drivers
Some of the factors leading to the market performances year-to-date include:
Fed rate hikes: The Fed has hiked the fed funds rate three times in 2018, putting upward pressure on the short end of the yield curve.
A strengthening dollar: U.S. dollar strength has put pressure on foreign-denominated assets (MSCI EAFE and MSCI EM* indices).
Increasing (but still stable) inflation measures: The personal consumption expenditure core index (PCE Core) and consumer price index (CPI) posted their highest readings since 2011.
Widening credit spreads: Both high-yield and investment-grade corporate bond yield spreads have drifted higher year-to-date.
Trade tensions: Tariff retaliations between China and the U.S., a new U.S.-Mexico-Canada agreement that will replace NAFTA, and continued escalated rhetoric have injected uncertainty into markets.
Energy: Oil falling because of record-high U.S. production and global economic growth in September has created an uncertainty great for consumers, but not for producers.
Some Good Tidings
Although not many asset classes seem to be “working” this year, it’s also important to note that even with the year-to-date returns, trailing returns are still solid for many markets, and investors have enjoyed the tailwinds of accommodative monetary policy, low interest rates, low volatility, low unemployment, a strengthening U.S. economy, and increasing U.S. consumer confidence for the past few years.
The path forward may be choppier and more volatile, with the possibility that returns could be lower than both the recent past and longer-term historical averages. However, it is important to remain cognizant of the longer-term roles of the various asset classes in portfolio construction:
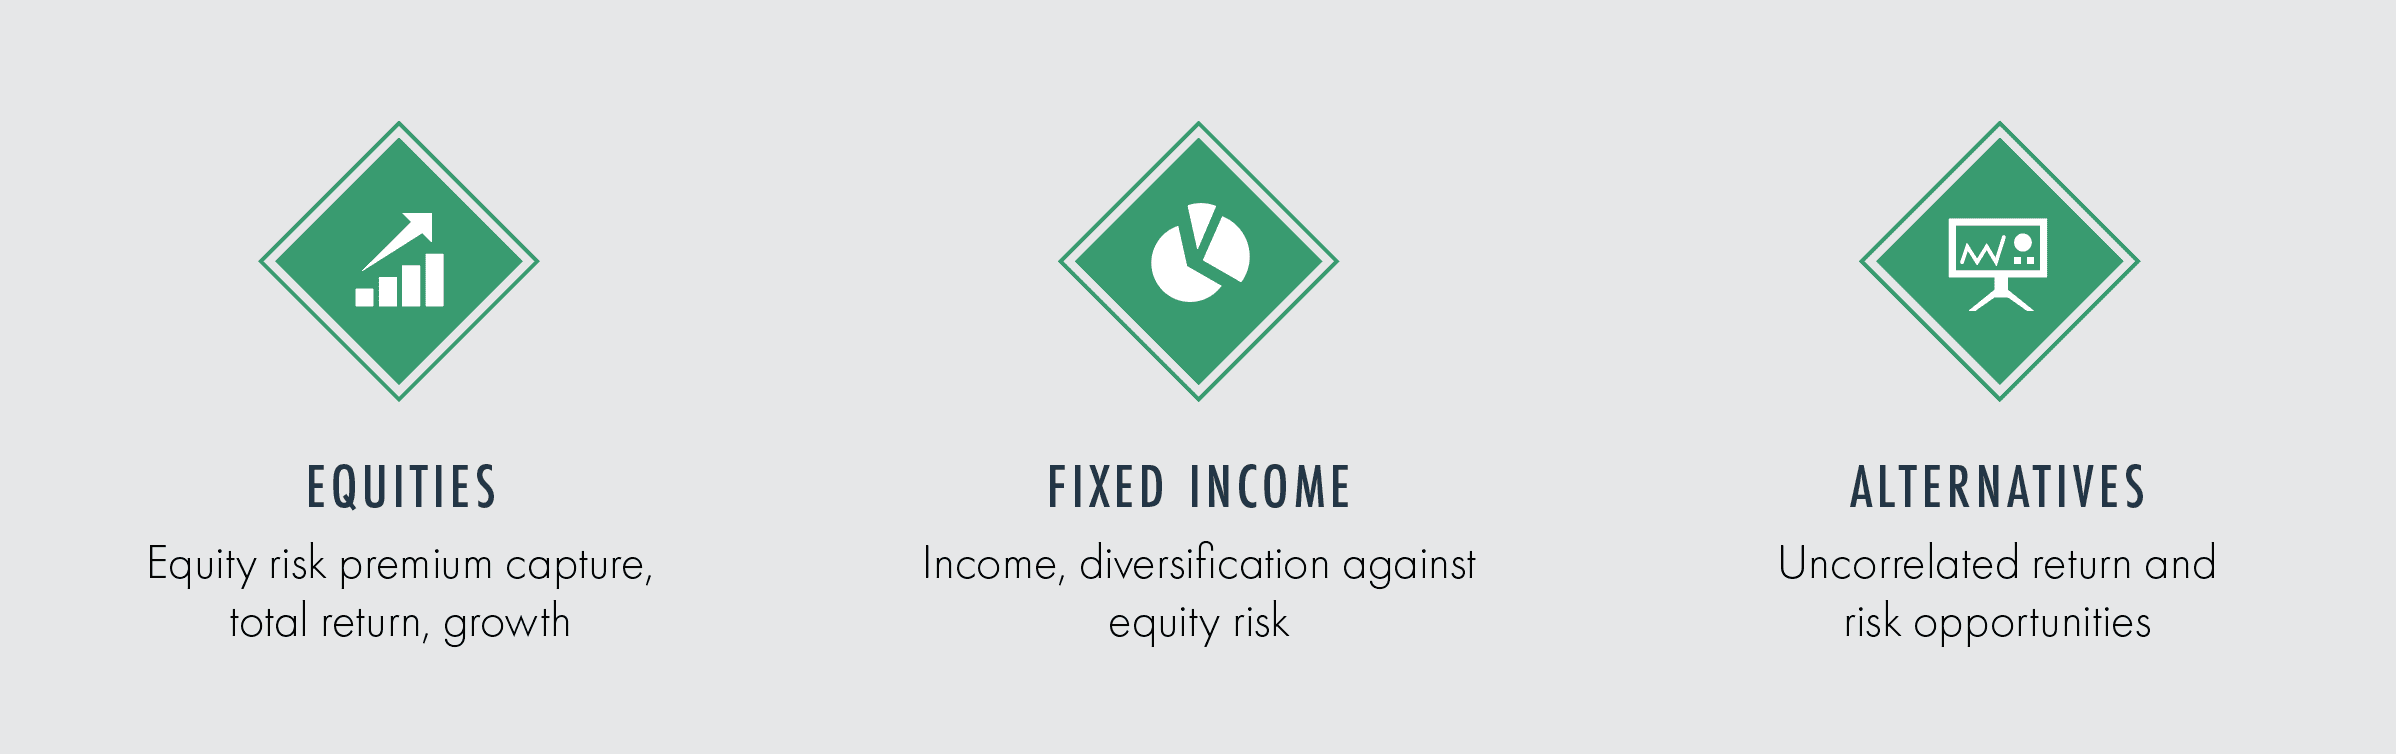
While 2018 may have been a bumpy ride for many markets, the long-term rationale for these asset classes is still relevant. Happy holidays, and here’s to next year.
*MSCI EAFE = MSCI Europe, Australasia and Far East index; MSCI EM = MSCI Emerging Markets Index
Geoffrey Eikmann | Senior Investment Analyst
These materials were prepared for informational purposes only. Information has been obtained from a variety of sources believed to be reliable though not independently verified. This presentation does not represent a specific investment, tax or other recommendation or legal advice, and does not take into consideration your particular circumstances, financial or otherwise. Examples provided herein are for illustrative purposes only and do not represent actual or anticipated results. This is not an offer to sell or buy securities. Please consult with your advisor, attorney and accountant, as appropriate, regarding specific advice. Past performance does not indicate future performance.