
Recent market activity has been both indicative of and a cause of increasing concerns. After reaching a record high in late July, the S&P 500 fell slightly more than 6% in the past three weeks. That decline was punctuated by the two largest daily point declines of the year on Aug. 5 (-87.31) and Aug. 14 (-85.72).
Other market-based indicators also show signs of increased fear. The Treasury yield curve inversion accelerated with the 2-year and 10-year spread inverting for the first time since 2007. The 30-year Treasury bond yield fell to a new record low level. Gold prices rallied to the highest levels in more than five years. And what are generally considered more defensive sectors of the equity markets are outperforming.
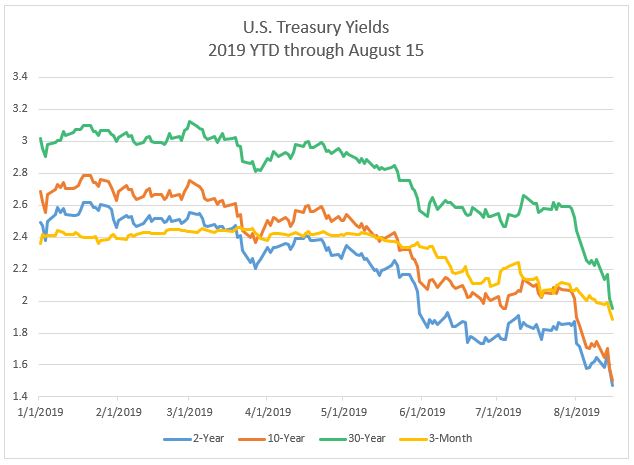
The inversion of the Treasury yield curve increased the recessionary concerns for many investors. On Aug. 14, the widely followed spread between the 2-year and 10-year inverted for the first time in this cycle, while other portions of the yield curve have been inverted since May. Historically, the yield curve has been a strong indicator of recessions and the worst bear stock markets tend to happen during recessions.
We caution against assuming a recession and bear market will immediately follow just because the 2- and 10-year spread inverted. In the wake of extraordinary global monetary policy of the past decade, there is some question as to the reliability of the yield curve’s predictive power. The Federal Open Market Committee even commented on this in its September 2018 meeting minutes:
“A few participants offered perspectives on the term structure of interest rates and what a potential inversion of the yield curve might signal about economic prospects in light of the historical regularity that an inverted yield curve has often preceded the onset of recessions in the United States. On the one hand, an inverted yield curve could indicate an increased risk of recession; on the other hand, the low level of term premiums in recent years — reflecting, in part, central bank asset purchases — could temper the reliability of the slope of the yield curve as an indicator of future economic activity.”
While we are closely watching the yield curve, we are also balancing its message against other indicators. The bond market has been subject to powerful forces in recent years in the form of extraordinary monetary policy, quantitative easing and, more recently, negative yields on an estimated $16 trillion worth of global sovereign debt. It would be naïve to think there aren’t unintended consequences/results of those actions, with the shape of global yield curves potentially being one of them.
What if the yield curve is correct and a recession is on the horizon? Research suggests it isn’t imminent and the equity markets still have room to the upside. According to an analysis by Credit Suisse, a recession has, on average, followed 22 months after an inversion of 2-year and 10-year Treasury yields. Moreover, for investors, markets can still produce positive returns following a yield curve inversion. Since 1978, the S&P 500 has risen 13%, on average, between the inversion and the start of the recession, according to Dow Jones Market Data. In the case of the past five recessions, research by LPL Financial shows the S&P 500 Index did not peak until almost a year after the yield curve inversion, with a median gain of nearly 22%.
In summary, recent market activity has been uncomfortable and increased investors’ concerns. While some of the daily point declines are eye opening, they come from record highs. On a percentage basis, what has happened is fairly normal. The S&P 500 is down 6% from its July peak, which most would characterize as a dip rather than a correction (defined as 10%). Corrections happen, on average, about once a year; smaller declines (5% to 10%) happen, on average, about three times as often, per Guggenheim. In other words, what has happened to date is normal.
Stocks (as measured by the S&P 500) are still up more than 13% for the year as we write this. Seasonally, we are in a relatively weak time for stocks with August (11) and September (12) ranked at or near the bottom of the 12 months in terms of historical performance. While economic growth appears to be moderating (partially in response to the uncertainty surrounding global trade), economic indicators (as opposed to market-based indicators) are not signaling a recession in the near term; monetary policy is still very “easy,” the unemployment rate is near historical lows and the leading economic indicators are still positive on a 12-month basis.
© 2019 Moneta Group Investment Advisors, LLC. All rights reserved. These materials were prepared for informational purposes only. You should consult with an appropriately credentialed professional before making any financial, investment, tax or legal decision. Past performance is not indicative of future returns. These materials do not take into consideration your personal circumstances, financial or otherwise.