Chris Kamykowski, CFA®, CFP® – Head of Investment Strategy & Research
Markets are flummoxed with changing expectations for how long the Fed will raise rates and for how long they hold at the eventual terminal rate. Market expectations at the beginning of the year largely coalesced around two 0.25% rate hikes before a Fed pause and then potential rate cut by the end of the year or early 2024. Recent economic data has put a wrench into those expectations as inflation has proved more resilient while trending lower, the labor market continues to be hot, and the economy may be side-stepping a recession in early 2023. Furthermore, the Fed has continued with its efforts to warn, advise, and guide the markets on the combination of factors in its framework for deciding on when to initiate a pause: namely, meaningful and persistent declines in the rate of inflation toward their 2% long-term target and weaker employment levels. Getting there may risk economic pain (e.g., recession) but as the Fed has noted time-and-time again, getting ahead of inflation now and taking whatever medicine is required, will be less onerous than what is needed if inflation rises and, importantly, inflation expectations become unanchored.
That all said, markets continue to hope for this somewhat “mythical” pause in rate hikes, which leads to two important questions: historically, how have US equity and investment grade fixed income returns behaved after the Fed has officially hit its terminal Fed funds rate? Additionally , while no two tightening cycles are the same, are there inferences we can make on the potential path for US equity and fixed income markets once the Fed pauses their current tightening cycle?
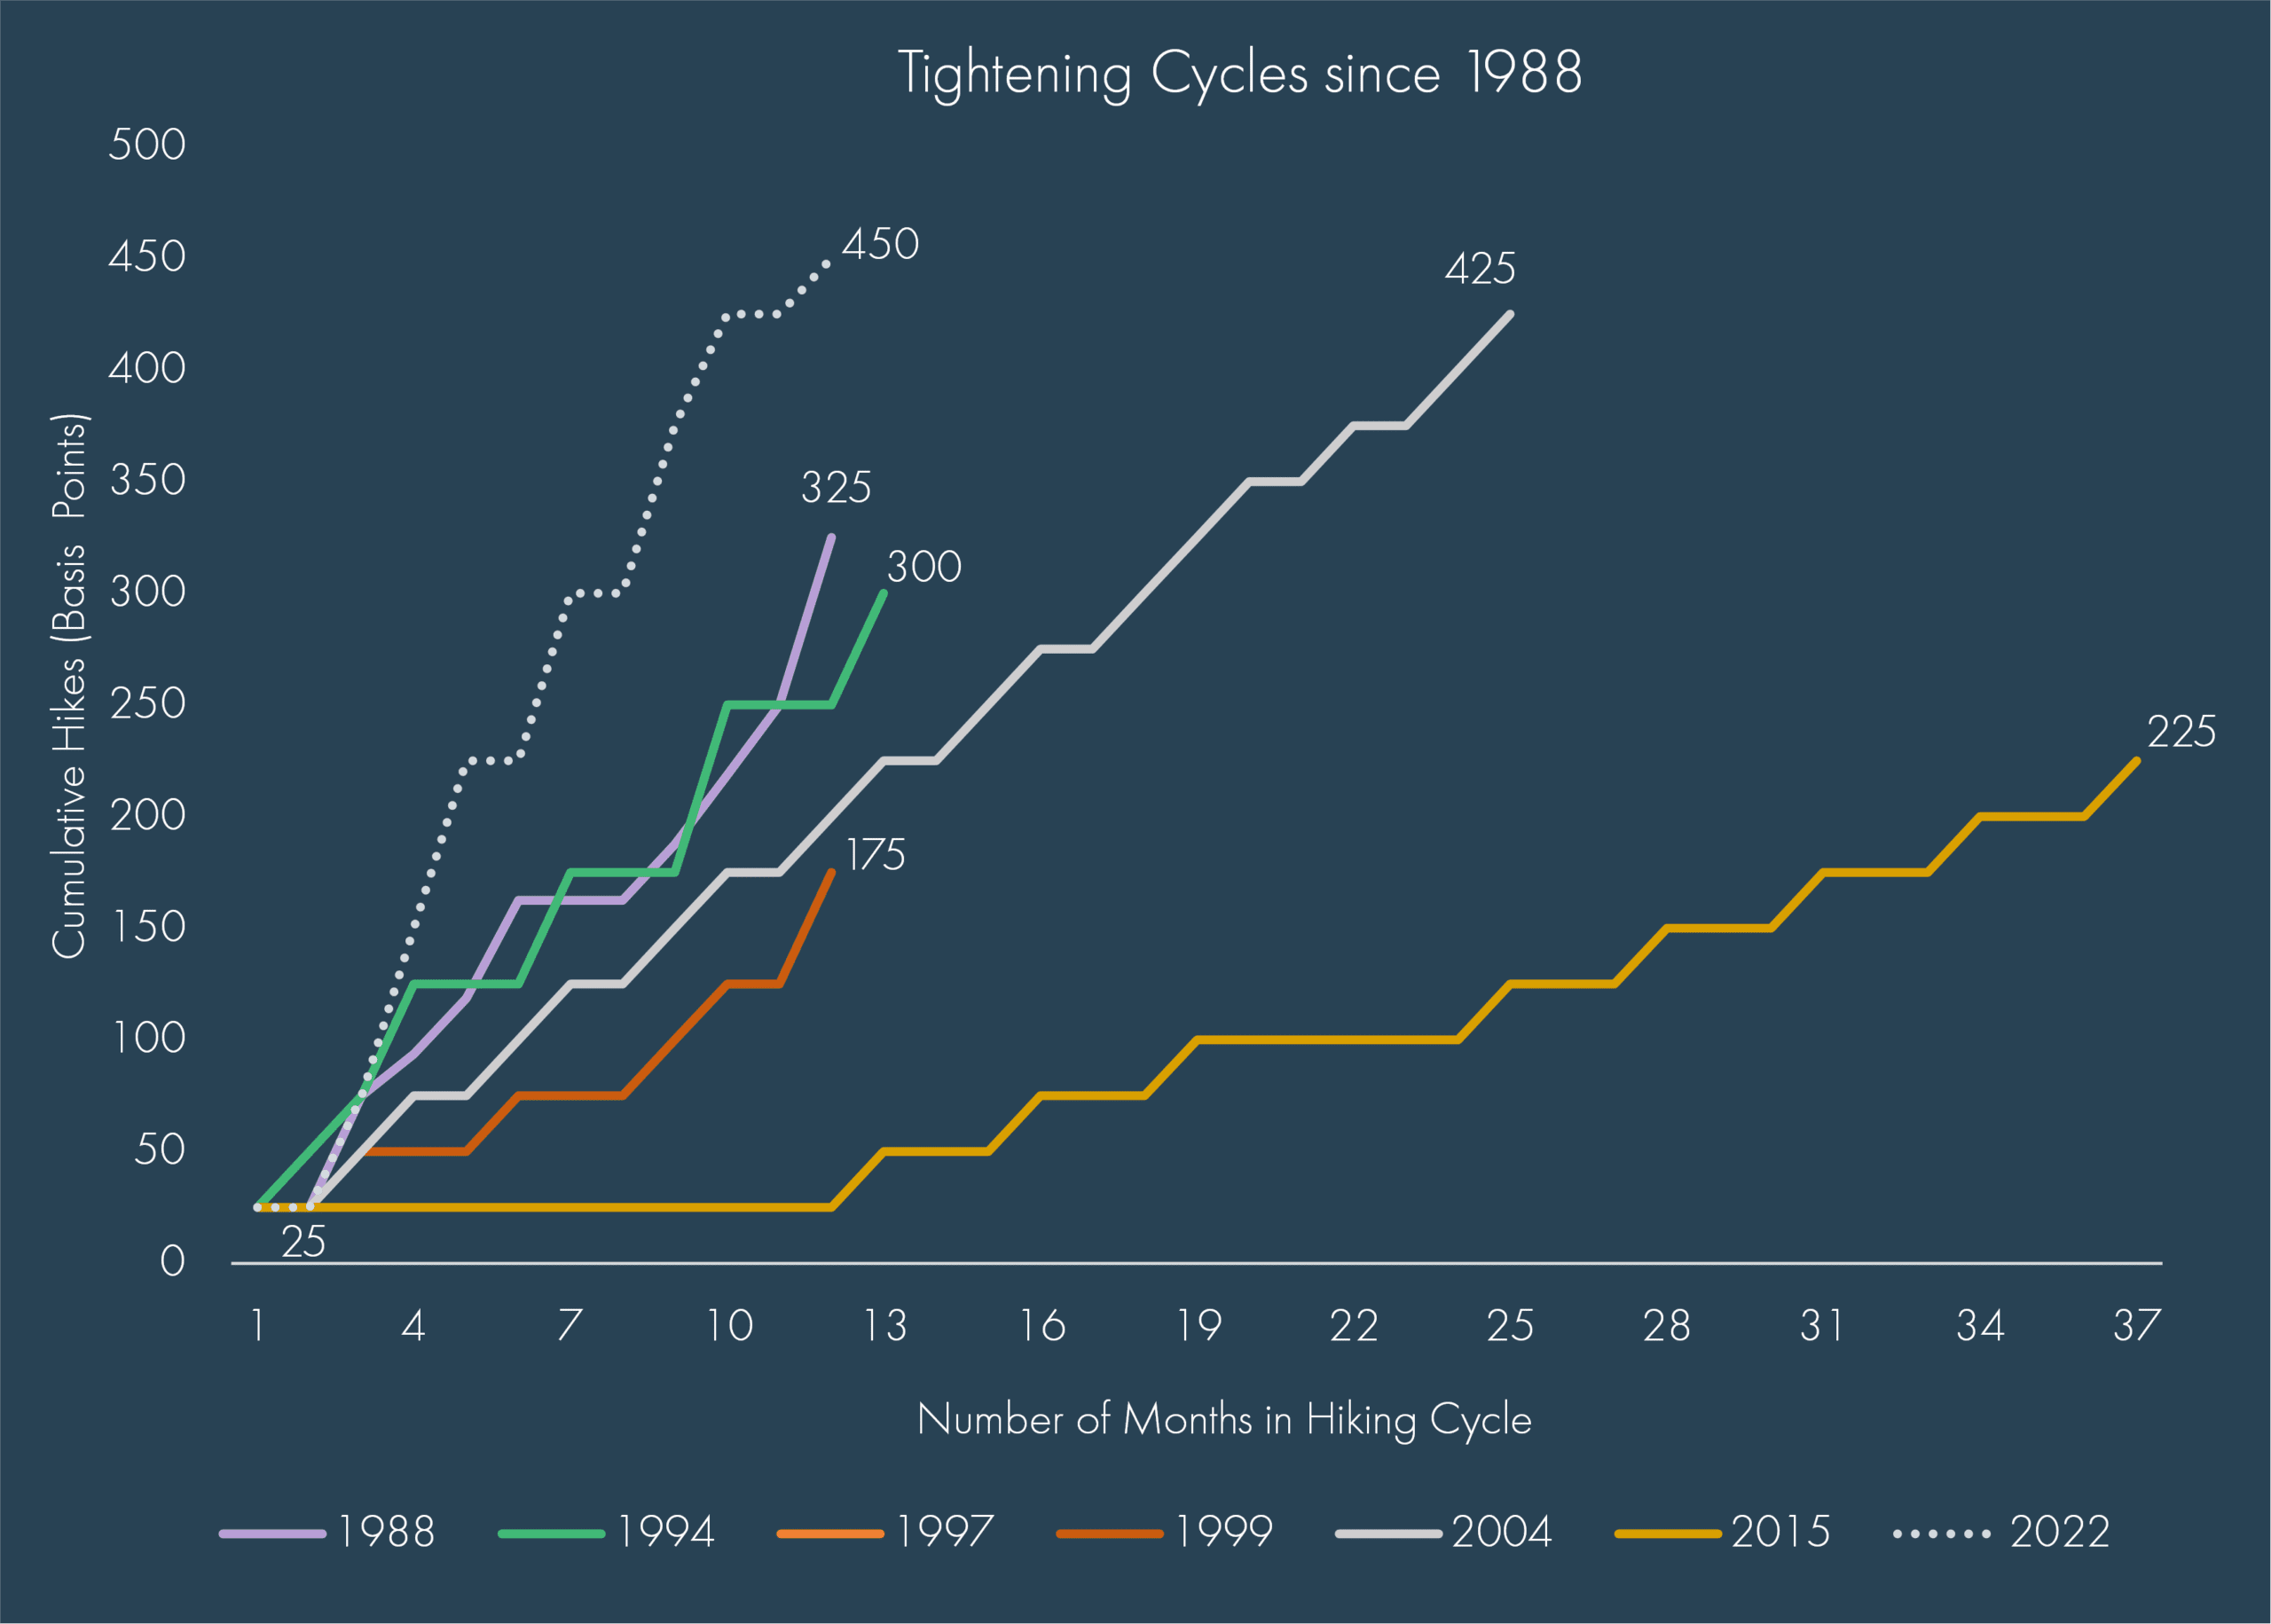
For historical reference, since 1988, there have been seven distinct interest rate hiking cycles, including the current one that commenced in March 2022. On average, the Fed funds rates has been hiked by 275 bps in each tightening period over an average of approximately 16 months. This current tightening cycle has been historically swift with the Fed funds rate moving 450 bps over 12 months and looks to continue.
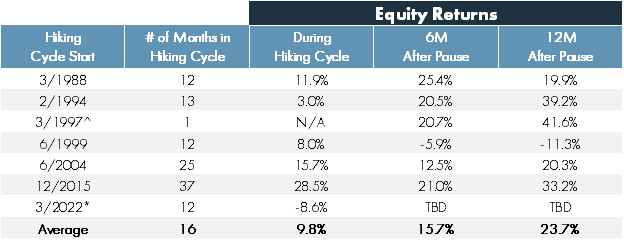
The two tables that follow highlight returns during, six months after and one year after the Fed concludes its hiking cycle (“pause)”. Over the previous six rate hike cycles, equity market performance during the rate hike cycles has, on average, been distinctly positive, although the most recent cycle has been definitively negative since its start. However, returns six- and 12-months after the Fed ends its rate hikes have been clearly positive on average, ranging from +15%-24%. The one time period that witnessed negative returns on the heels of the pause in rate hikes, was the 1999-2000 hiking cycle. This was driven largely by the immense deflating of the tech bubble of the early 2000s.
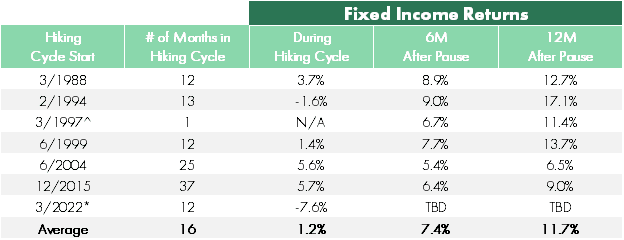
What may be a surprise to investors is how the fixed income market has done through these periods, given rising rates typically drive bond prices lower. While average returns during the hiking cycles have been subdued to outright negative, the average return for bonds after the final rate hike has been 7% and 12% for the subsequent six- and 12-month periods, respectively. The benefit of higher yields is higher yields, which can provide a less volatile interest rate environment and more stable return profile as the market transitions to a less hawkish Fed.
There are clear reasons for the current consternation in the markets and why a single increase in the expected number of rate hikes has caused recent drawdowns in the market: impatience for the Fed letting off the brakes and added uncertainty as to when this “pause” will commence. The market loathes uncertainty and reacts accordingly. However, as has been shown, markets have performed well on the other side of the termination of a Fed hiking cycle; it may be no wonder why investors are impatient to see rate hikes finish. That said, as has been noted many times, investors should continue to use their own investment objectives, risk tolerances, and liquidity needs to dictate their appropriate long-term investment allocation while avoiding changes due to the uncertainty of the Fed’s decisions. Maintain a portfolio that is properly diversified to weather the volatility and uncertainty that the market will undoubtedly experience throughout each year.
Sources:
Morningstar
Federal Reserve
Definitions:
The S&P 500 Index is a free-float capitalization-weighted index of the prices of approximately 500 large-cap common stocks actively traded in the United States.
The Bloomberg US Aggregate index is a broad-based flagship benchmark that measures the investment grade, US dollar-denominated, fixed-rate taxable bond market.
Disclaimer
© 2023 Advisory services offered by Moneta Group Investment Advisors, LLC, (“MGIA”) an investment adviser registered with the Securities and Exchange Commission (“SEC”). MGIA is a wholly owned subsidiary of Moneta Group, LLC. Registration as an investment advisor does not imply a certain level of skill or training. The information contained herein is for informational purposes only, is not intended to be comprehensive or exclusive, and is based on materials deemed reliable, but the accuracy of which has not been verified.
Trademarks and copyrights of materials referenced herein are the property of their respective owners. Index returns reflect total return, assuming reinvestment of dividends and interest. The returns do not reflect the effect of taxes and/or fees that an investor would incur. Examples contained herein are for illustrative purposes only based on generic assumptions. Given the dynamic nature of the subject matter and the environment in which this communication was written, the information contained herein is subject to change. This is not an offer to sell or buy securities, nor does it represent any specific recommendation. You should consult with an appropriately credentialed professional before making any financial, investment, tax or legal decision. An index is an unmanaged portfolio of specified securities and does not reflect any initial or ongoing expenses nor can it be invested in directly. Past performance is not indicative of future returns. All investments are subject to a risk of loss. Diversification and strategic asset allocation do not assure profit or protect against loss in declining markets. These materials do not take into consideration your personal circumstances, financial or otherwise.