As we begin a new year and look toward what it may bring, negative headlines and declining stocks have many investors fearing the worst. I, however, remain cautiously optimistic about 2019’s outlook. Let’s look closer at the indicators giving me that perspective:
ISM REPORT
The Institute for Supply Management (ISM) Report — based on surveys of more than 300 manufacturing firms — is one of the first major economic reports out in any given month and very close to real time data. It can thus greatly influence the tone of investor and business confidence. It also provides important insights on a variety of topics in the manufacturing sector: prices, employment, orders, etc.
Manufacturing is less than 20% of the US economy, but still a vital component. Trends in manufacturing sentiment and activity are often an important barometer for what is happening in the broader economy.
A reading of 50 in the ISM Report is the cut line – above it things are improving and below it things are deteriorating. Thursday morning, the overall ISM Manufacturing Index came in at 54.1 for December. This still reflects general growth and is a good (not great) number. However, it was below 55 for the first time since December of 2016.
Why is that important? Above 55 is usually coincidental to the Fed raising interest rates, below 50 when the Fed lowers rates and 50 to 55 when the Fed is on hold. One month does not constitute a trend, but this bears watching. If the overall ISM Manufacturing Index reading remains below 55 in the coming months, it could be a good guide to divining the Fed’s interest rate policy.
Of bigger concern was the specific new orders index from that same ISM Report. It dipped to 51.1 (positive, but barely), the lowest since late 2015/early 2016. This data is for December and the holidays can distort economic data, but one has to think that some of this is due to trade concerns and an indication of moderating economic activity. These are things to watch closely in the coming months.
TREASURY YIELD CURVE
Here is a picture of the Treasury yield curve this morning vs. a month ago. A couple of things jump out: the sharp decline in yields and the odd shape. The 1-year Treasury is yielding more than the 2- and 5-year and is only 5 bps less than the 10-year. And the 2-year note currently yields more than the 5-year note.
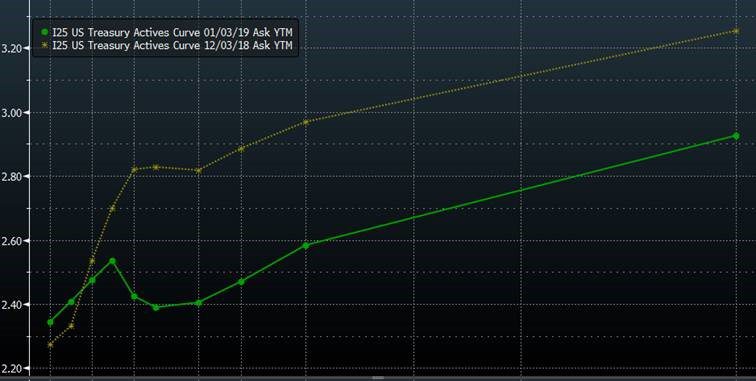
(Source: Bloomberg)
S&P 500 PERFORMANCE
Looking at the sectors of the S&P 500 during Thursday’s sharp decline, utilities and real estate were actually up; the biggest decline was in the tech sector. One of the things we are watching is the relative performance between small and large cap stocks. Historically, small caps tend to outperform large caps this time of year (the January Effect, which actually starts in mid-December). That hasn’t been the clear case in this correction, but the last couple of days have been somewhat encouraging on that front. Both the Russell 2000 and S&P 600 were flat to positive the first day and a half of trading.
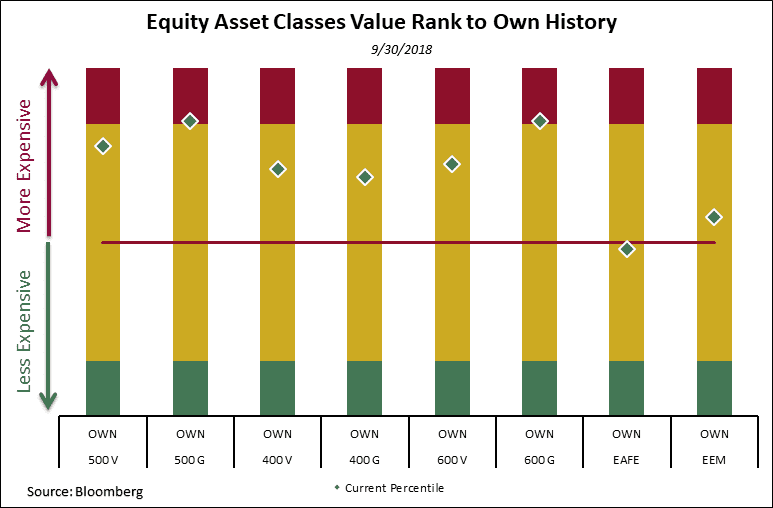
STOCK VALUATIONS
And finally, look how much valuations changed last quarter. Stocks now appear (for the most part) to be on sale. Valuations alone don’t turn markets, but if you believe price matters (we do) then today’s lower valuations increase the prospects of forward returns. They can get cheaper, but it has been a long time since we saw most of the equity segments below the long term averages. The first chart represents valuations as of September 30, 2018 and the second represents valuations as of yearend.

REASONS TO REMAIN OPTIMISTIC
The headlines are full of news that the economy is decelerating and the financial markets – in the form of weaker stocks and a partially inverted/flat yield curve – are feeding those concerns. Stocks have suffered a meaningful decline already and it feels like the proverbial “blood in the streets.” Here are a couple of things to think about around all of this in no particular order:
- The markets act like pendulums and typically swing too far at inflection points. No one likes the current weakness, but is it really any different (other than direction) than the S&P 500 trading at 30 times earnings in June of 1999 at the top of the tech bubble “melt up”?
- The best returns have their genesis in tough markets with clear rational thought, patience and discipline.
- The economy is still growing and monetary policy is still accommodative. The worst bear markets typically coincide with recessions. It doesn’t appear we are currently in recession, although it appears growth is moderating. The NY Fed puts the odds of a recession at 15%, up from previous months, but not much.
- It appears that confidence is waning and we are in a negative feedback loop as it relates to markets and the economy. The political rhetoric and the stock market are certainly feeding that currently, but unemployment remains low and consumers have been given a nice gift in the form of lower energy prices. Those are very large positive considerations.
Cheers,
Bill