By Aoifinn Devitt | Chief Investment Officer
Highlights
- The fourth quarter saw new highs in US equity markets as markets continued to display the stubborn resilience that has characterized much of the post-COVID rally. Volatility did spike as the quarter rolled on though, suggesting a growing discomfort with surrounding risks as the quarter advanced. Large cap again trumped small cap domestically and US markets outperformed global markets in a repeat of their recent pattern. Sectors in favor rotated towards value-oriented from growth-oriented names towards the end of the quarter.
- Geopolitical risks included tensions between the US and Russia with respect to the Ukraine, as well as growing evidence of the lengths to which some Asian economies are willing to go to mitigate COVID risk, and as the quarter progressed more awareness of these risks was evident.
- The Omicron variant sent global COVID case numbers soaring, tripping up corporate plans to reopen and the hospitality industry’s nascent recovery, while new measures around quarantine, masking and travel restrictions only served to muddy the waters and cause sentiment to falter.
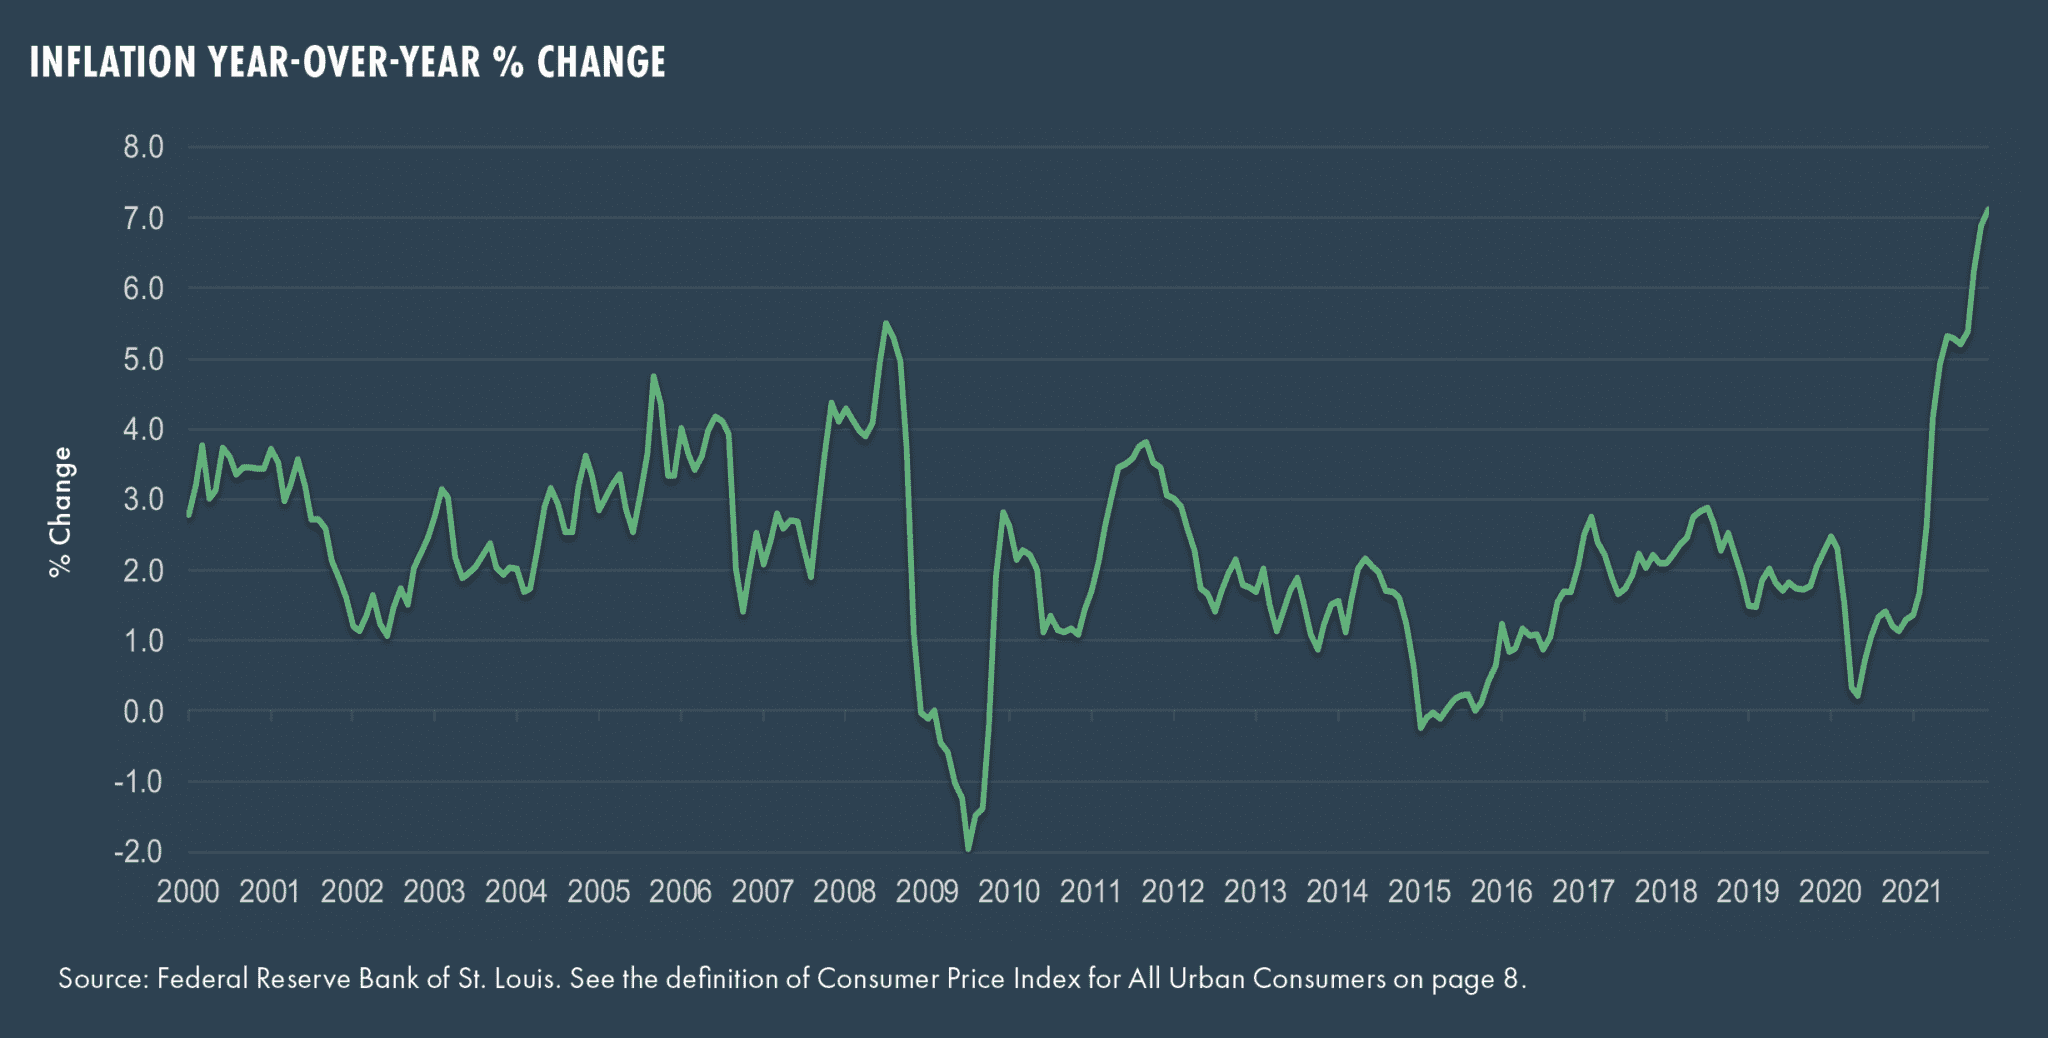
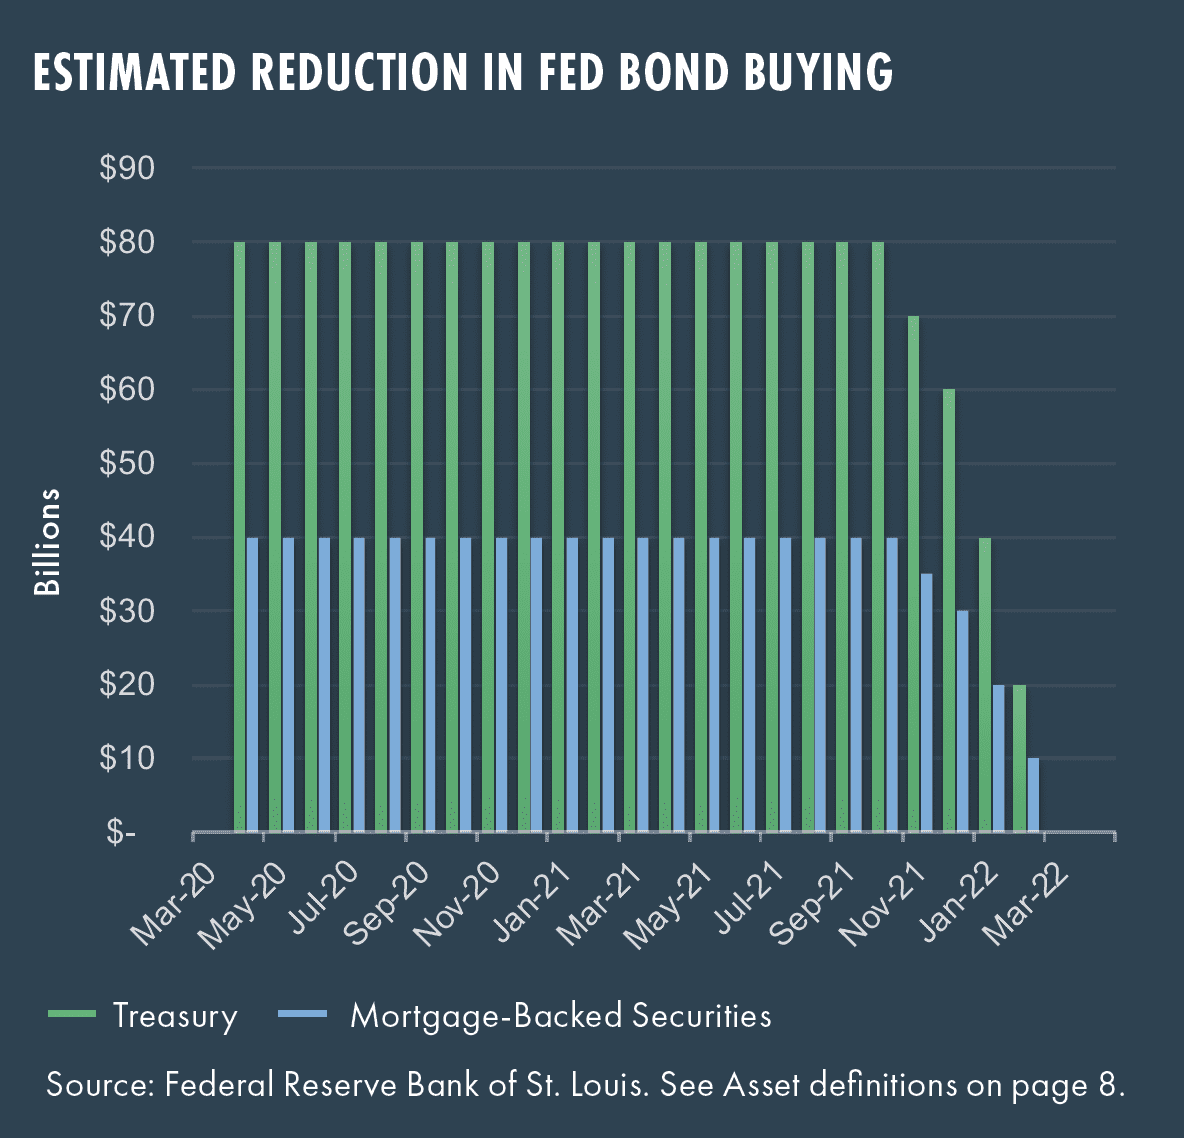
- Inflation and its rise globally was the dominant narrative of the fourth quarter as rates reached multi-decade highs, rising to 7% for the month of December (reported in January 2022). The US Federal Reserve began to signal a more aggressive stance towards both reining in bond purchases (tapering) and interest rate increases, and this led to mortgage rates reaching their highest level since April 2020.
- Fixed income returns were muted for the quarter, with the notable exception being TIPS, which responded to rising inflation, as might be expected.
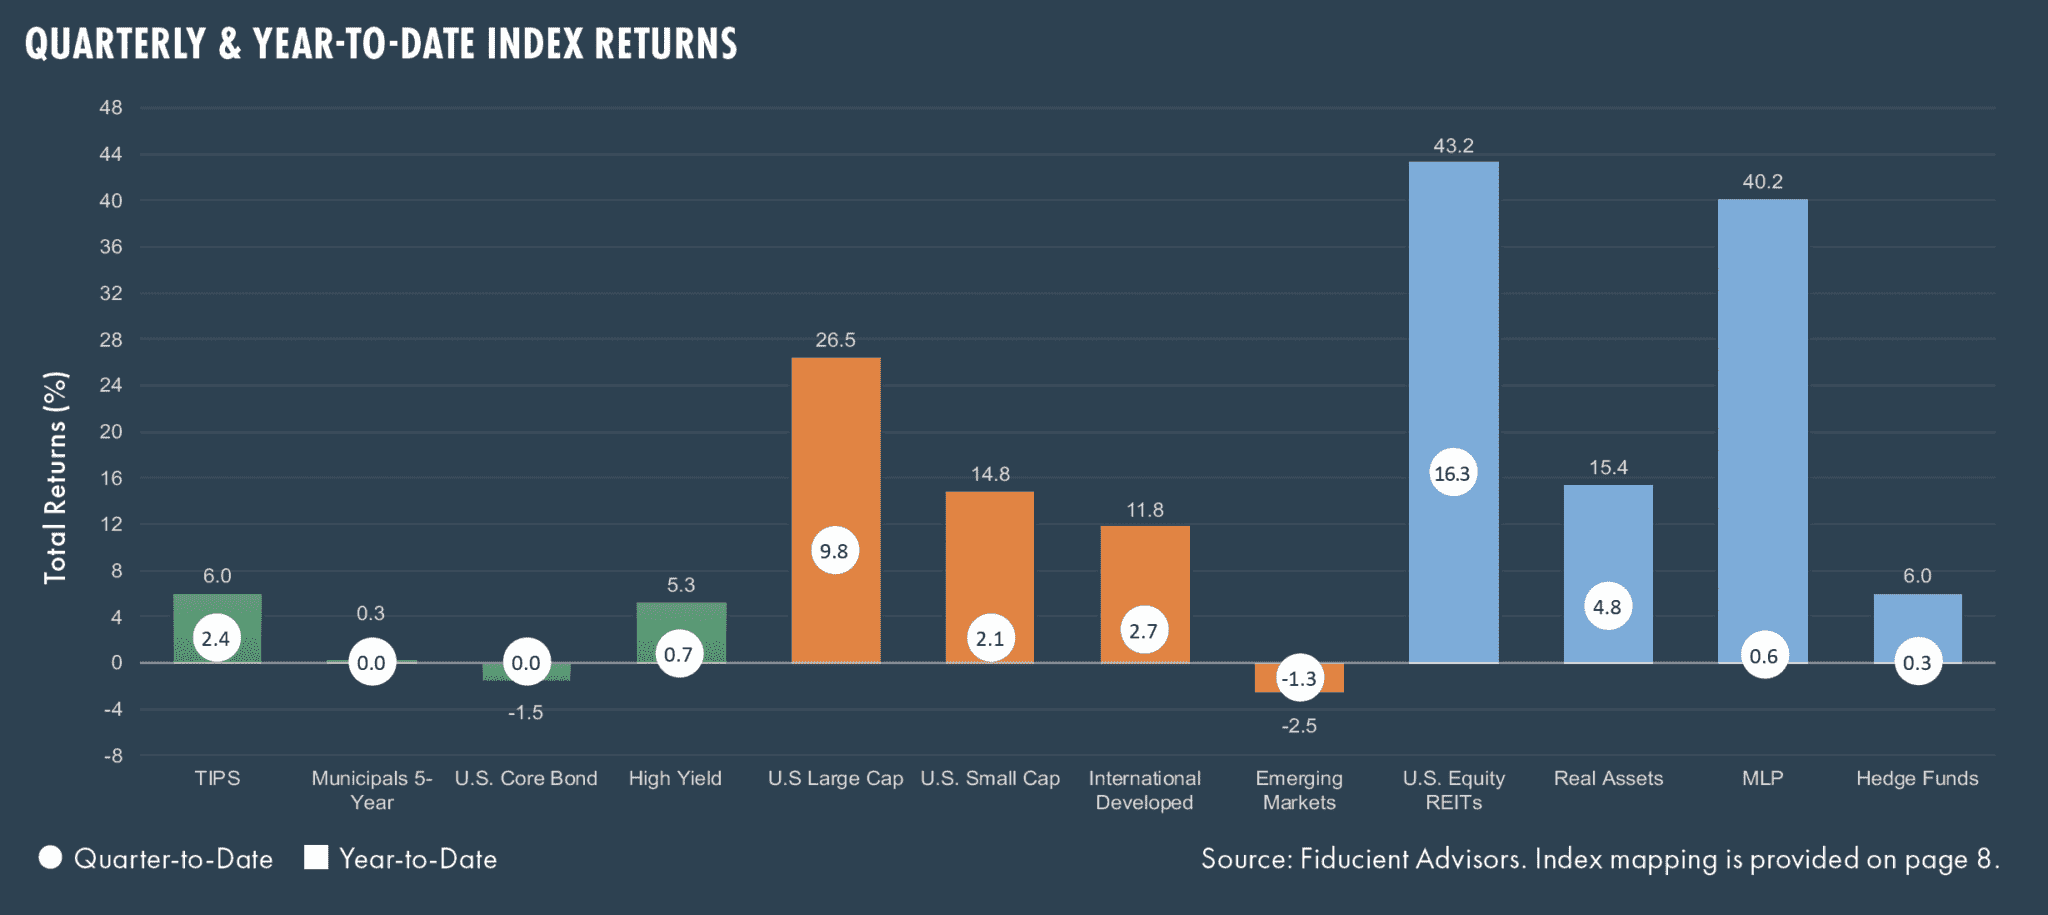
- Real assets saw strong demand as traditional inflation resilient assets, and REITs in particular saw a rise of more than 17% for the quarter, bringing their return to slightly more than 43% for the full year.
Macro Stories
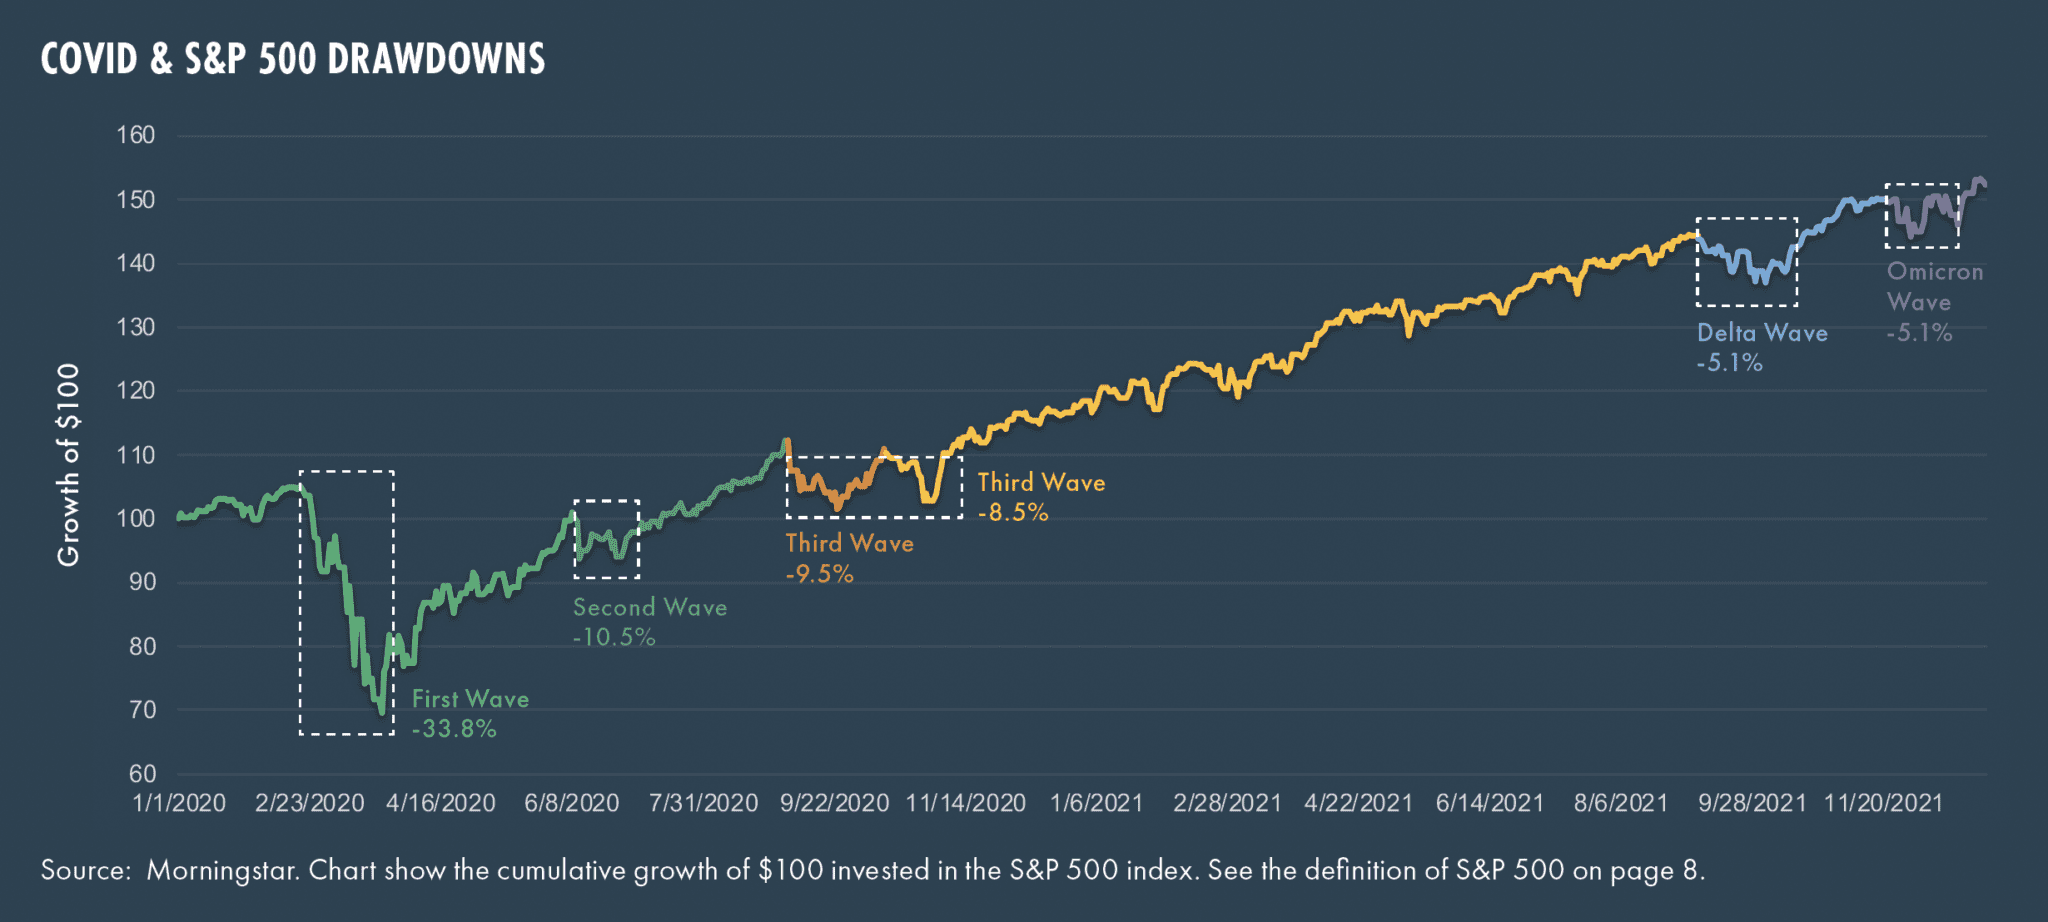
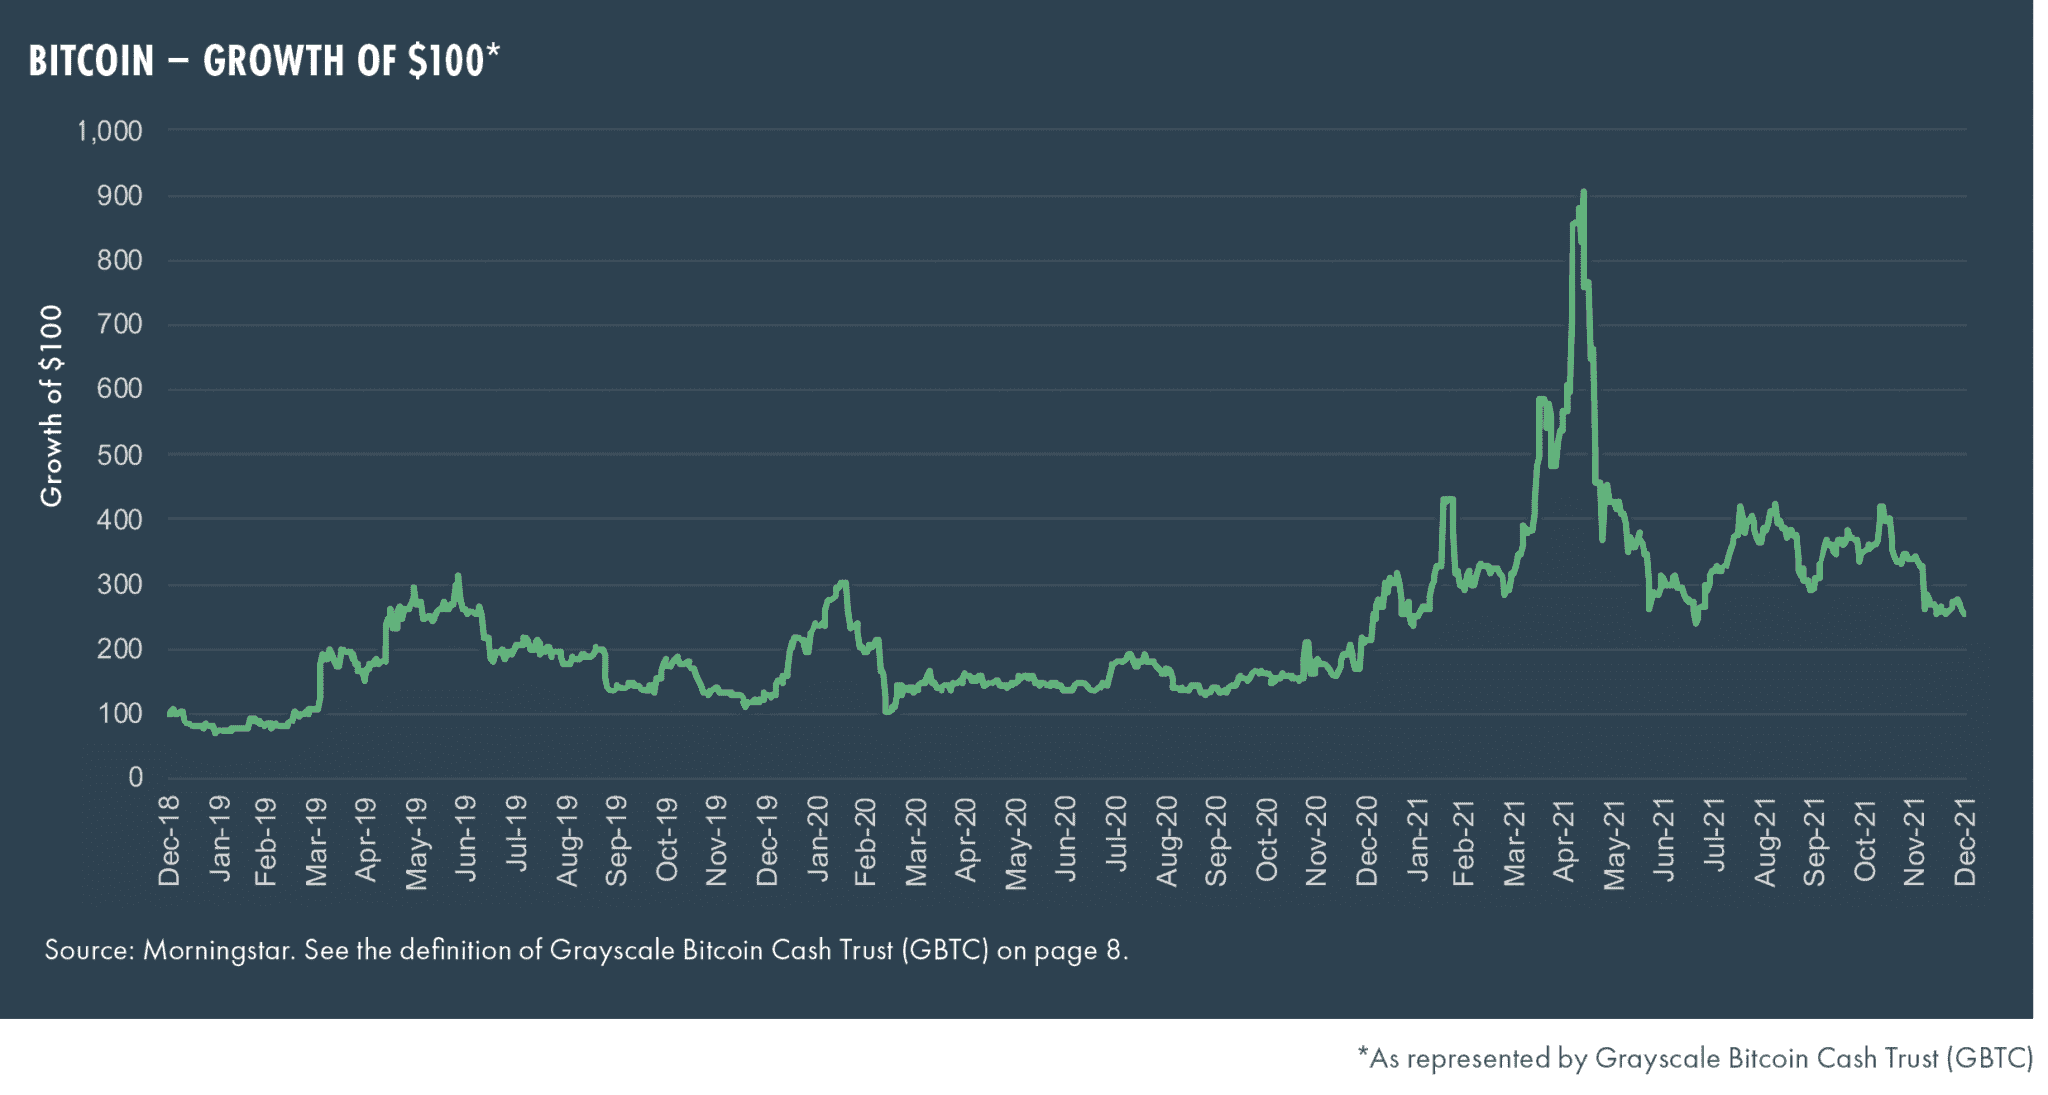
The Omicron variant and its rapid spread was not the coda that investors expected in 2021, which ended in a more chaotic and unsettled state than even 2020. With breakthrough cases widespread and broad encouragement of a third booster shot, the hope that vaccinations would spell the end of COVID seemed to evaporate. The evidence of lower hospitalization and death rates did point to the variant being milder, but the specter of high case numbers did initially seem to foreshadow a winter of renewed shutdowns. As the chart below shows, though, markets slowly but steadily girded themselves against COVID-related setbacks:
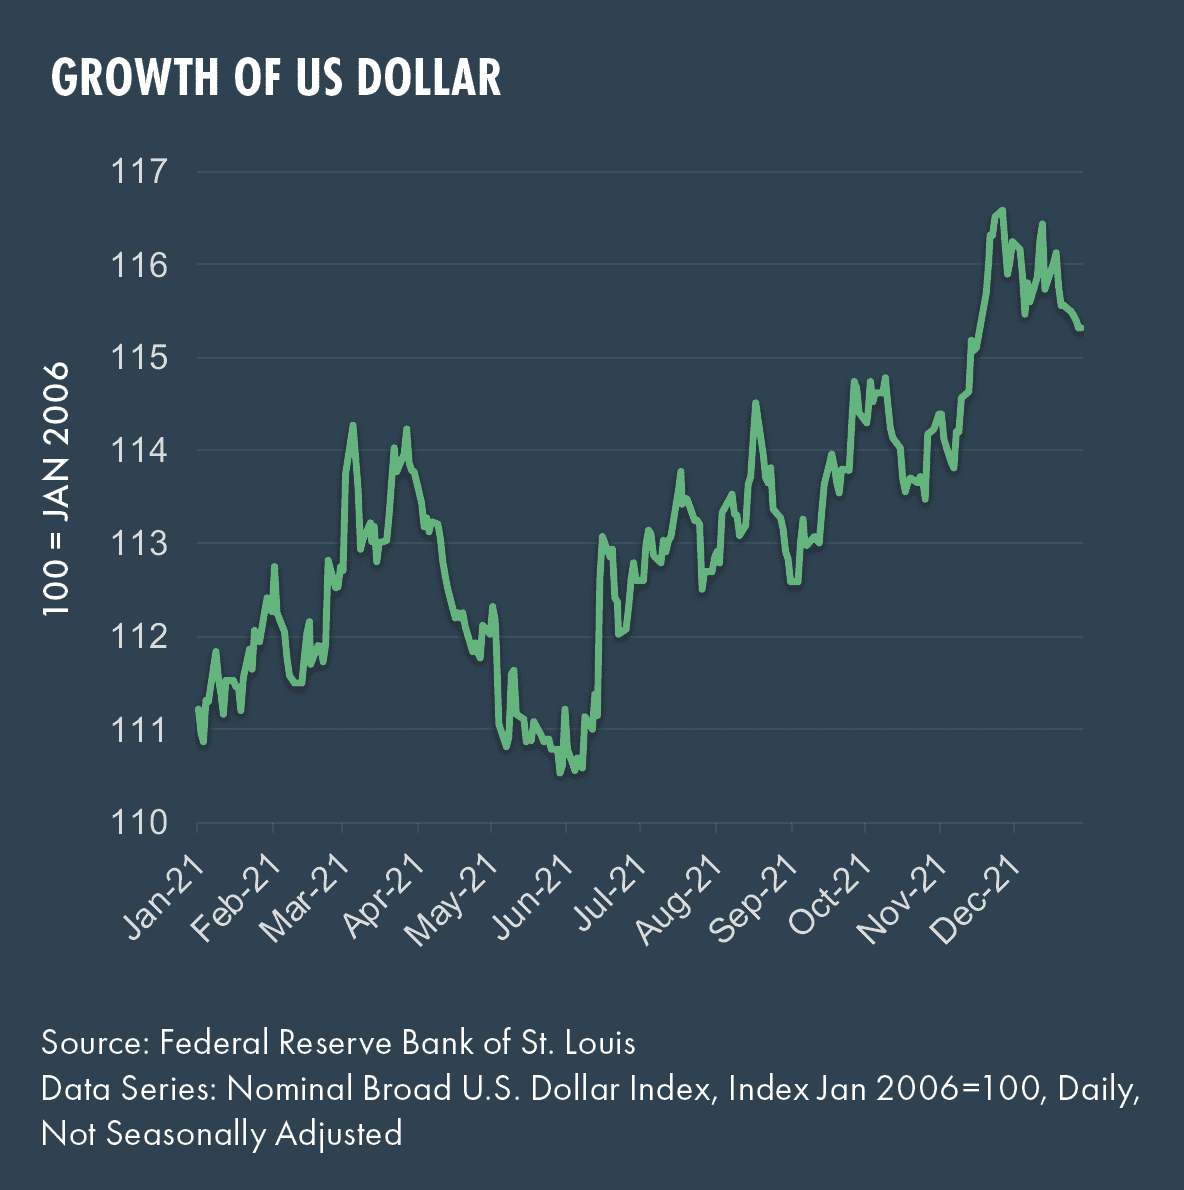
The US dollar remained strong as the global macro picture seemed equally unclear amid ongoing COVID shutdowns and economic setbacks.
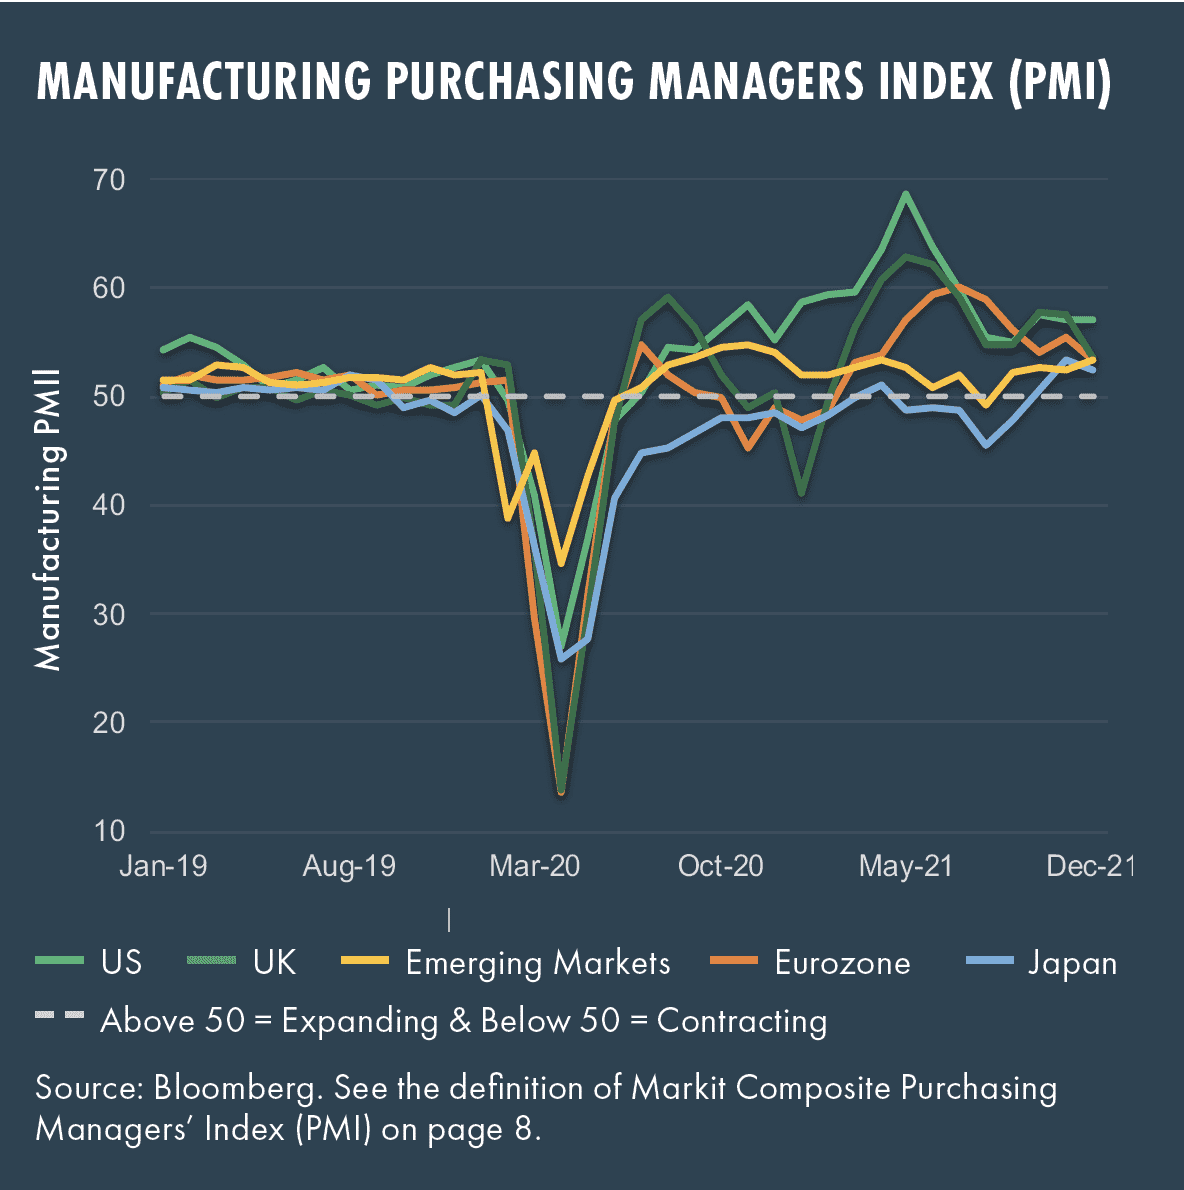
Last quarter, we showed the faltering of the Purchasing Managers Index globally. As the chart below shows, sentiment as measured by the Purchasing Managers Index continued to be volatile.
The inflation levels reported reflecting 2021 saw levels at a 40-year high.
The Fed dot plot and its evolution indicates the adoption of a more aggressive stance by the Fed in the face of mounting inflation. The first step in the two-pronged assault will be the reduction of the bond buying program, while the second is likely to be kicking off a rate rise trajectory as early as March 2022.
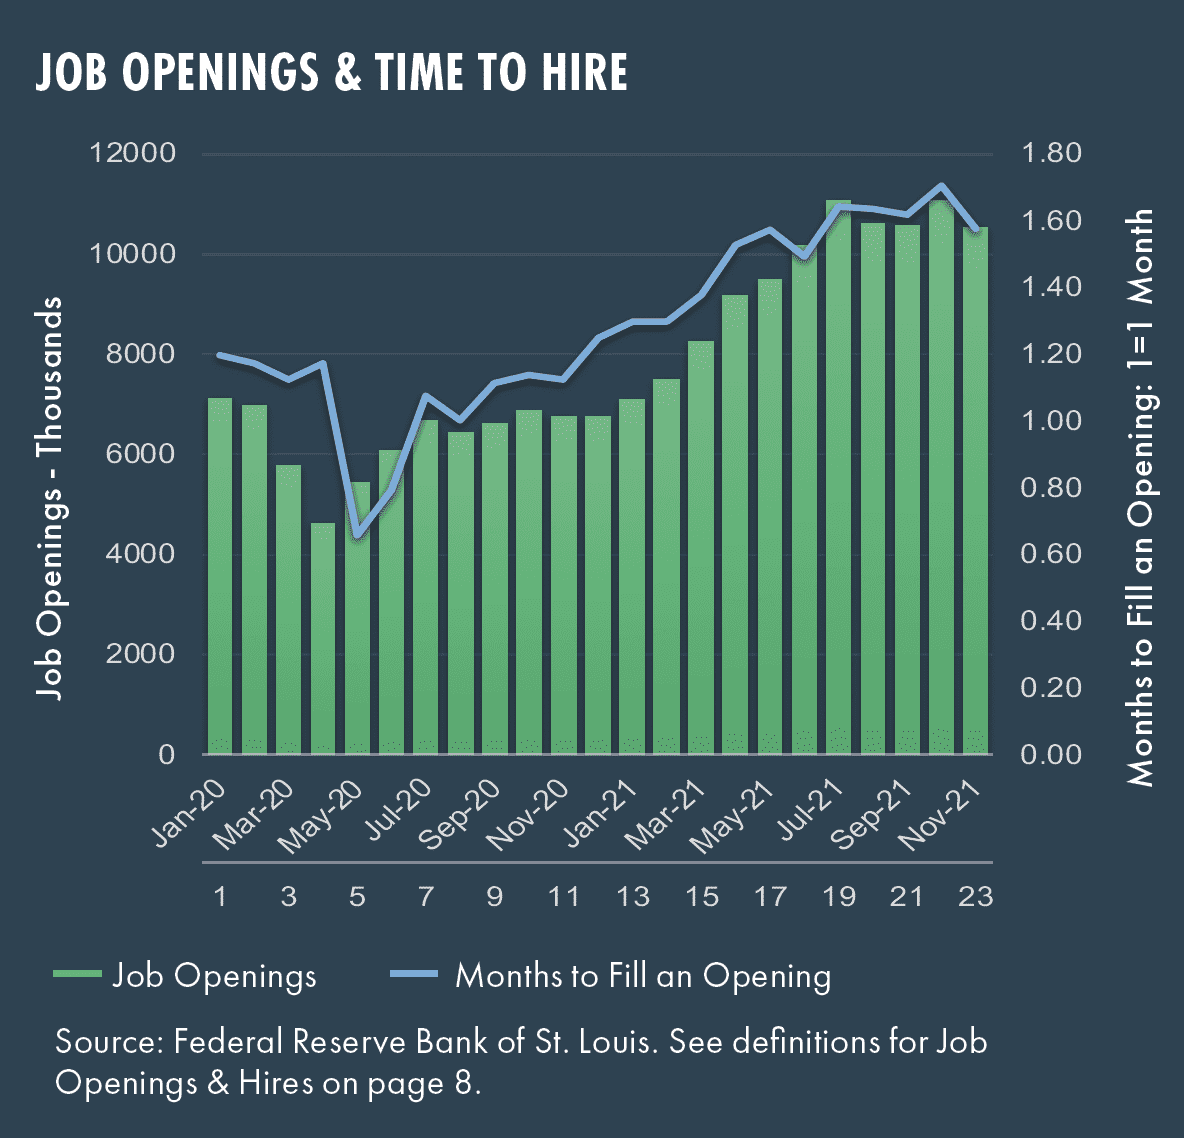
US unemployment continues to track downwards and hit a post pandemic low of 3.9% in December 2021. Job openings are at multi-decade highs and the time needed to fill an opening is now well-over a month. The imbalance in the labor market has taken some economists by surprise, given that many expected workers would flood the job market after enhanced pandemic unemployment benefits ended in early September.
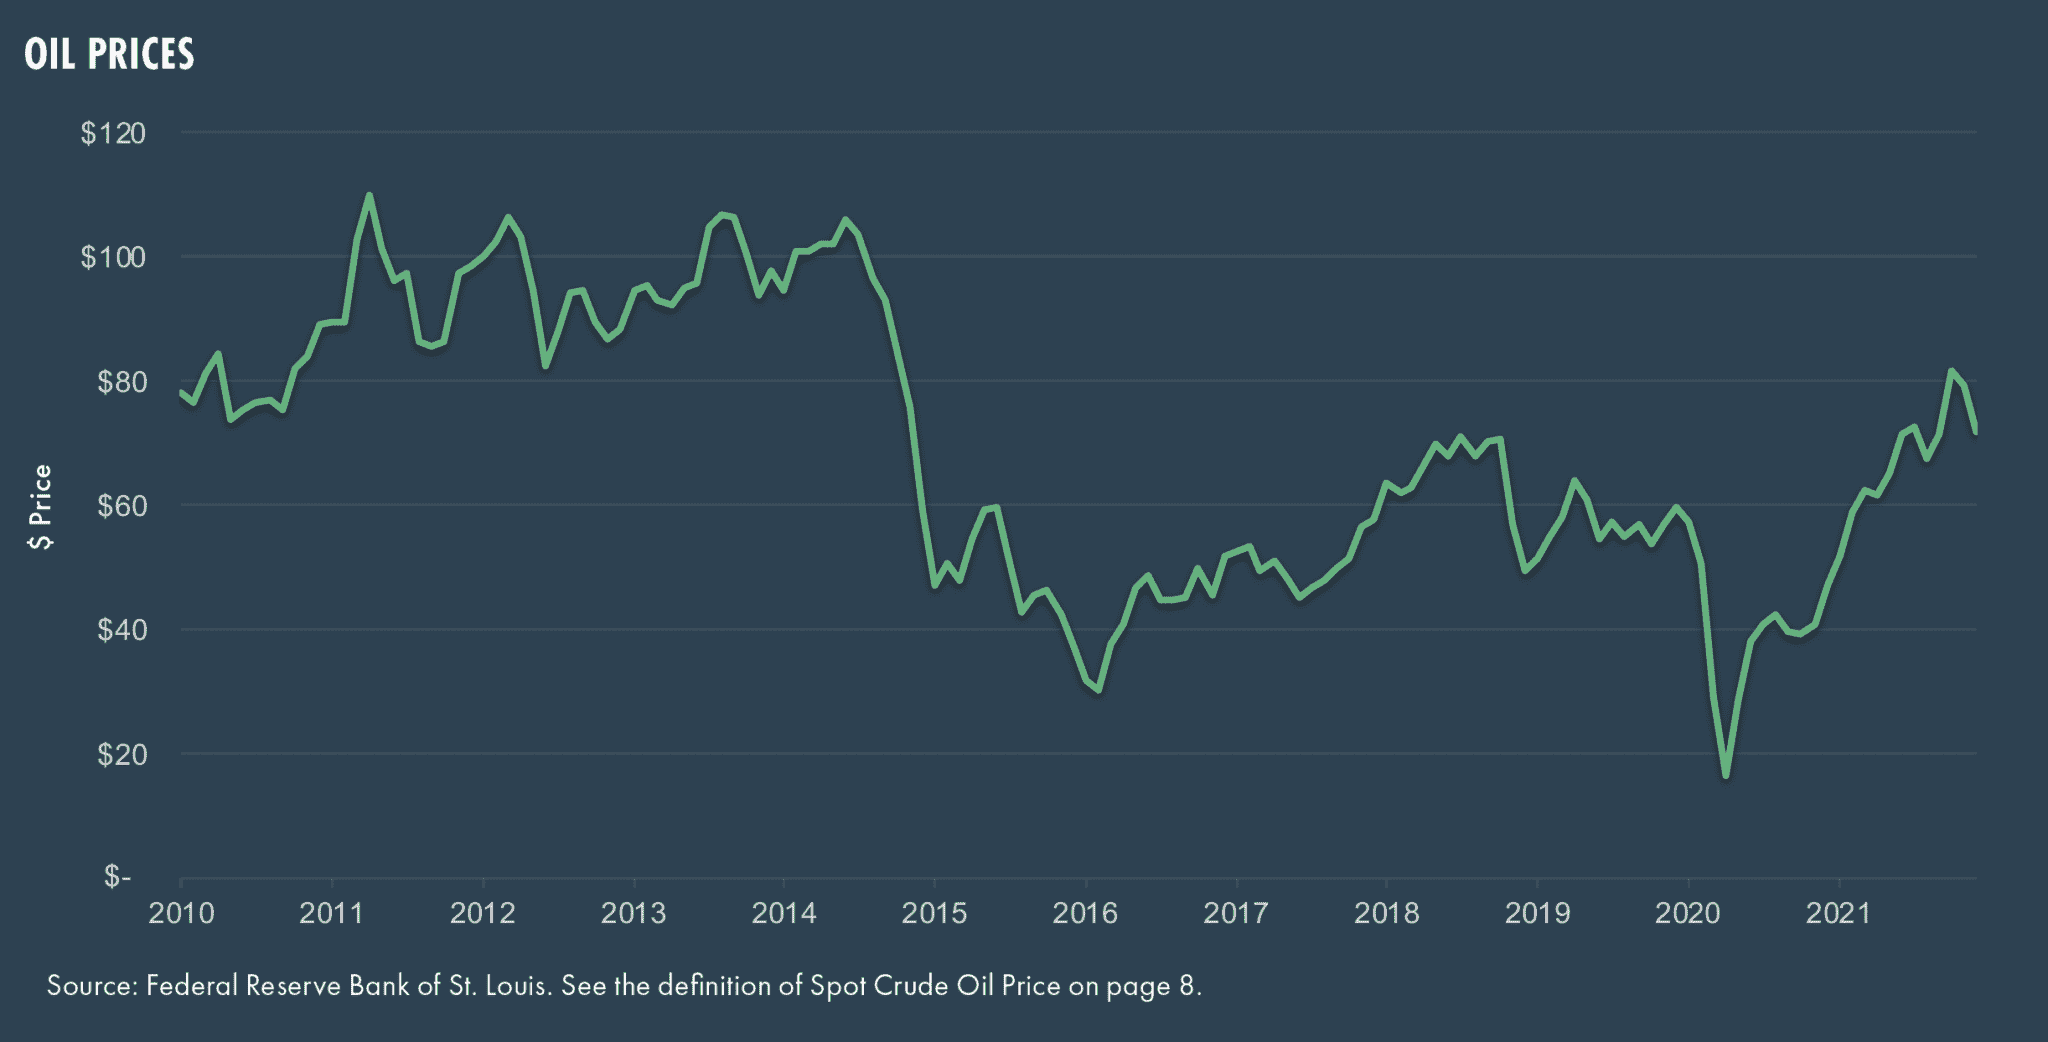
Energy prices eased initially in the quarter but spiked again at year end, leading to a total return for US Brent Oil of close to 62% for the calendar year. Clearly seen as a barometer of economic activity and outlook, the downward movement in oil prices took the sting out of some of the sharp year-end inflation figures.
Precious metals such as gold continue to languish (-4.33% for the year despite a recovery of 3.9% in the fourth quarter). Maybe this is due to the appearance from the wings of another shiny object – cryptocurrency, which is quickly establishing itself as a risk/reward asset that sits at the outer edge of the risk/reward spectrum.
Asset Class Performance
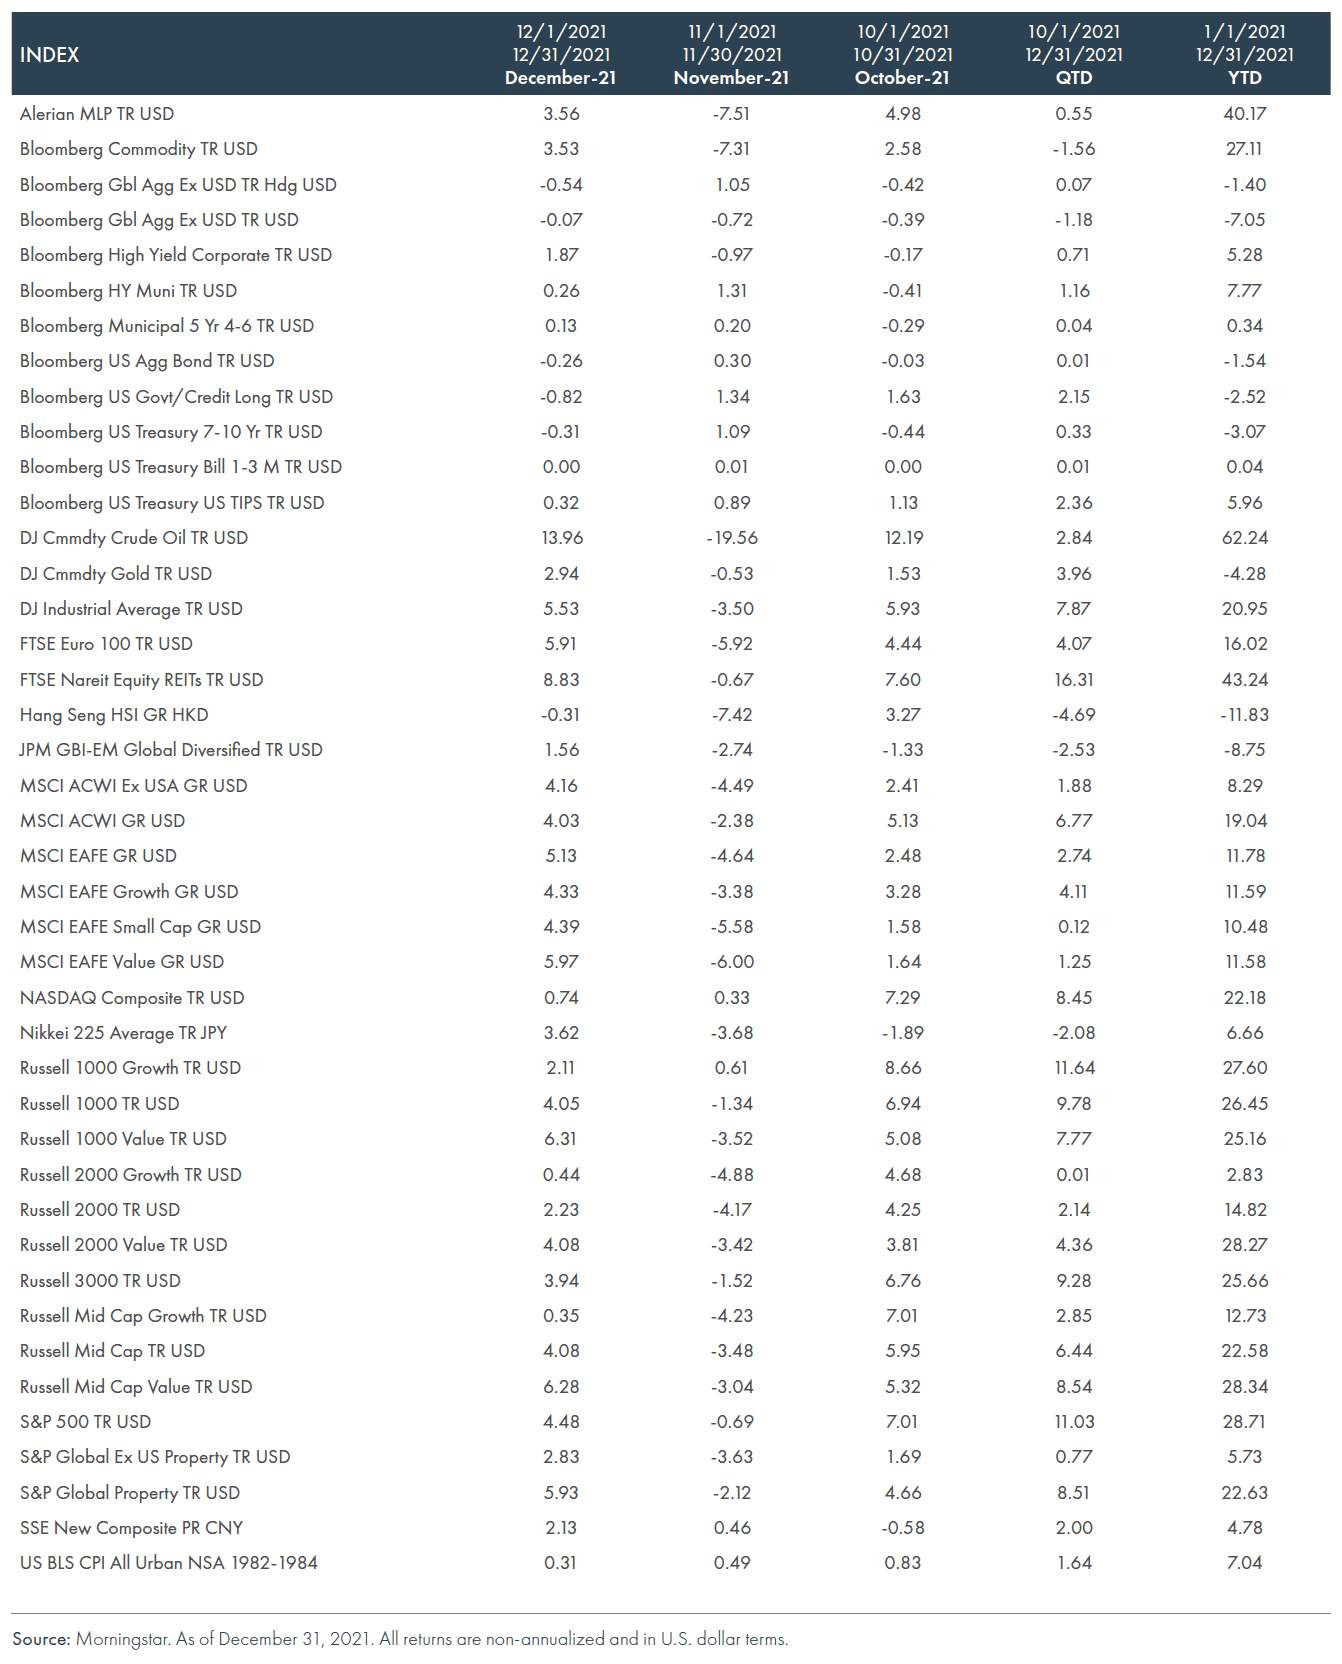
The fourth quarter marked a welcome respite from a lack-luster third quarter for asset returns, as the chart below shows, with every asset class in positive territory or thereabouts, and only Emerging Markets equities showing a negative return (-1.3%). Real assets and real estate (REITs) surged as inflation remained elevated, while domestic equities were dominated by large cap stocks. Fixed income was led by TIPs, reflecting the higher inflationary levels, while core bonds and even high yield barely registered a positive return for the quarter.
The Russell 1000 delivered nearly 10% for the quarter, bringing the year-to-date performance to +28.7%. The Russell 2000 only added 2.14% in the fourth quarter (+14.8% year to date).
Non–US markets continued to lag, and the MSCI Emerging Markets index lost 1.3% during the quarter, leading to a still-negative year to date (-2.54%).
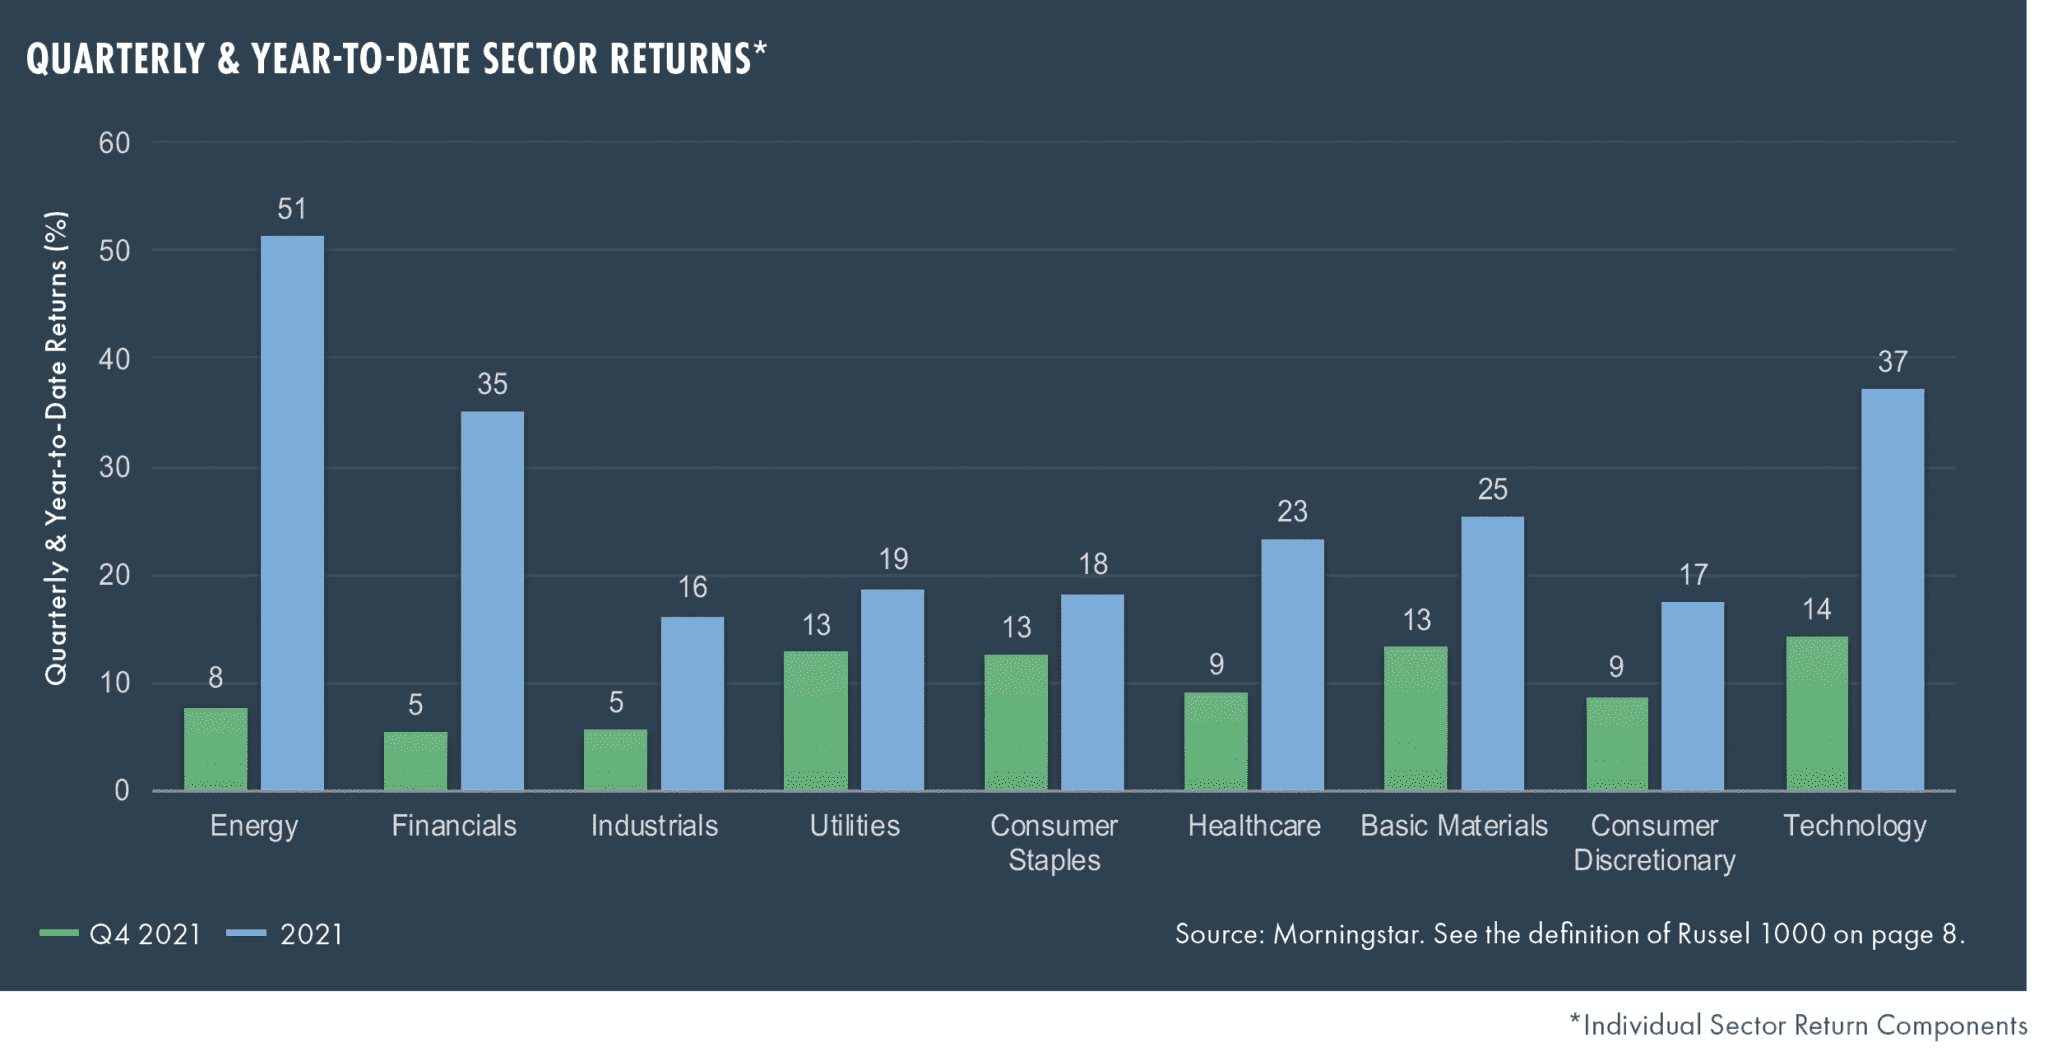
All sectors saw gains, as shown below, particularly consumer staples and utilities.
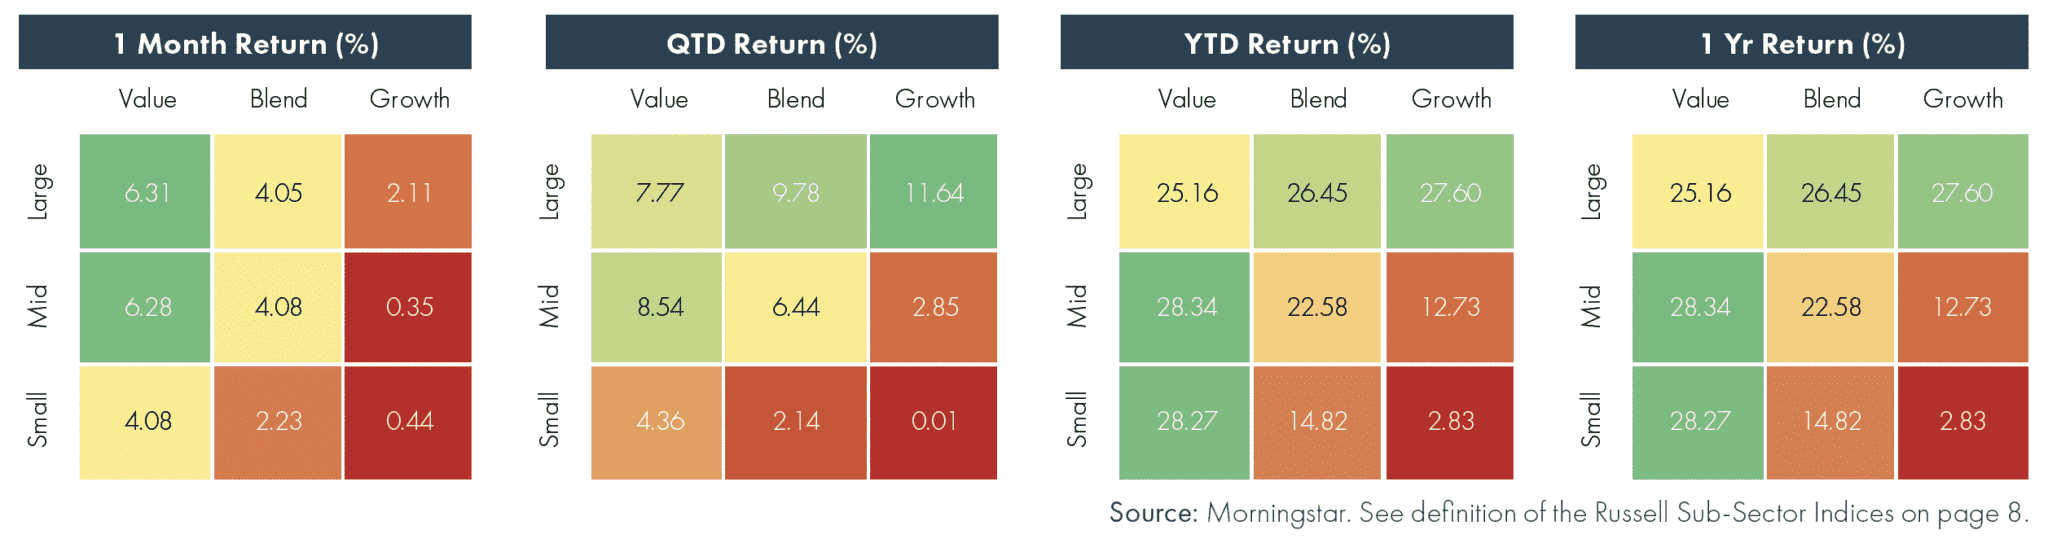
US Market Cap and Style Returns
The chart below shows the rotation to value and the decline towards the end of the quarter of sentiment towards growth stocks. This theme played out spectacularly in January 2022 as investors soured on some of the higher valuation tech stocks.
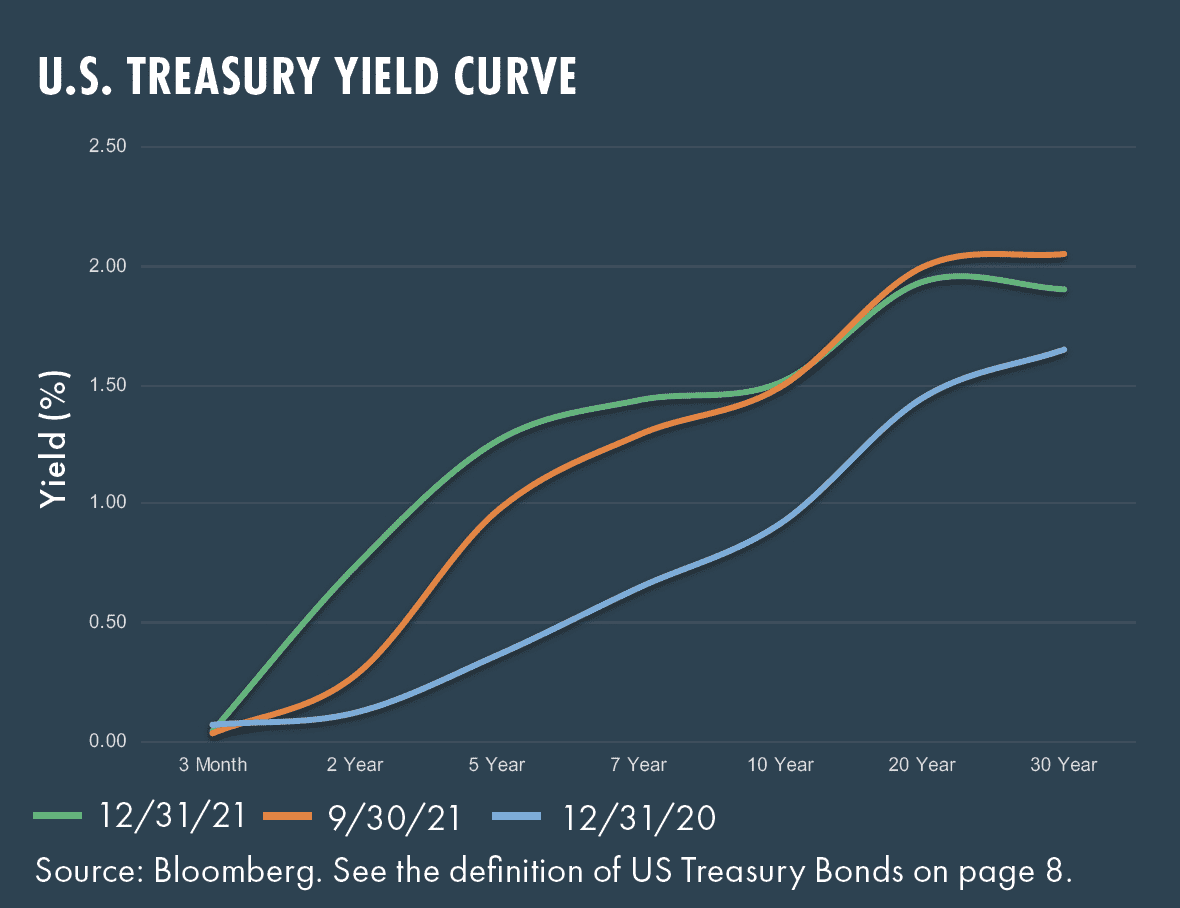
Moving to fixed income, per the chart below, the US Treasury yield curve saw a steepening as the long end responded to the prospect of higher rates. It is still relatively flat, however, indicating a muted long-term outlook.
Overall, the quarter was another relatively flat one for the fixed income asset class. Core bonds eked out a very modest return and high-yield returns were again just shy of 1%, bringing year-to-date returns for this asset class to 5.3%.
Outlook
- As we write, we are in the throes of a volatile start to the year in markets in 2022. The past week saw the S&P enter correction territory (-10% from its most recent high) and it currently looks to be the worst month since March 2020 for the S&P. Late January saw the markets stage dramatic intra-day reversals with the Dow recovering from losing more than 1000 points for the first time in history. Nasdaq saw its own biggest intra-day reversal since 2008.
- More volatility is likely to persist as the markets continue to focus on future interest rate action by the Federal Reserve, geopolitical tensions fester and inflation hovers at new highs.
- We continue to watch for reversion to the mean in non-US markets as those economies diverge in their approach to “living with COVID” (e.g. the UK, much of the EU compared with Asian economies). This would drive currencies such as the Euro and the GBP and maybe steal some of the thunder from the US equity markets as the year evolves.
- Last quarter, we mentioned the fanfare of the UN Conference of the Parties in Glasgow on October 31 (COP26). As expected, we saw the announcements from that event focusing on methane reduction, re-forestation, the generation of more incentives around “green finance” and a pledge to assist developing economies meet global standards and accelerate the energy transition away from fossil fuels. We expect investment in and the development of investment products around these initiatives to pick up pace throughout 2022 and believe sectors such as renewable energy, battery storage and electric vehicles will continue to see strong investor interest.
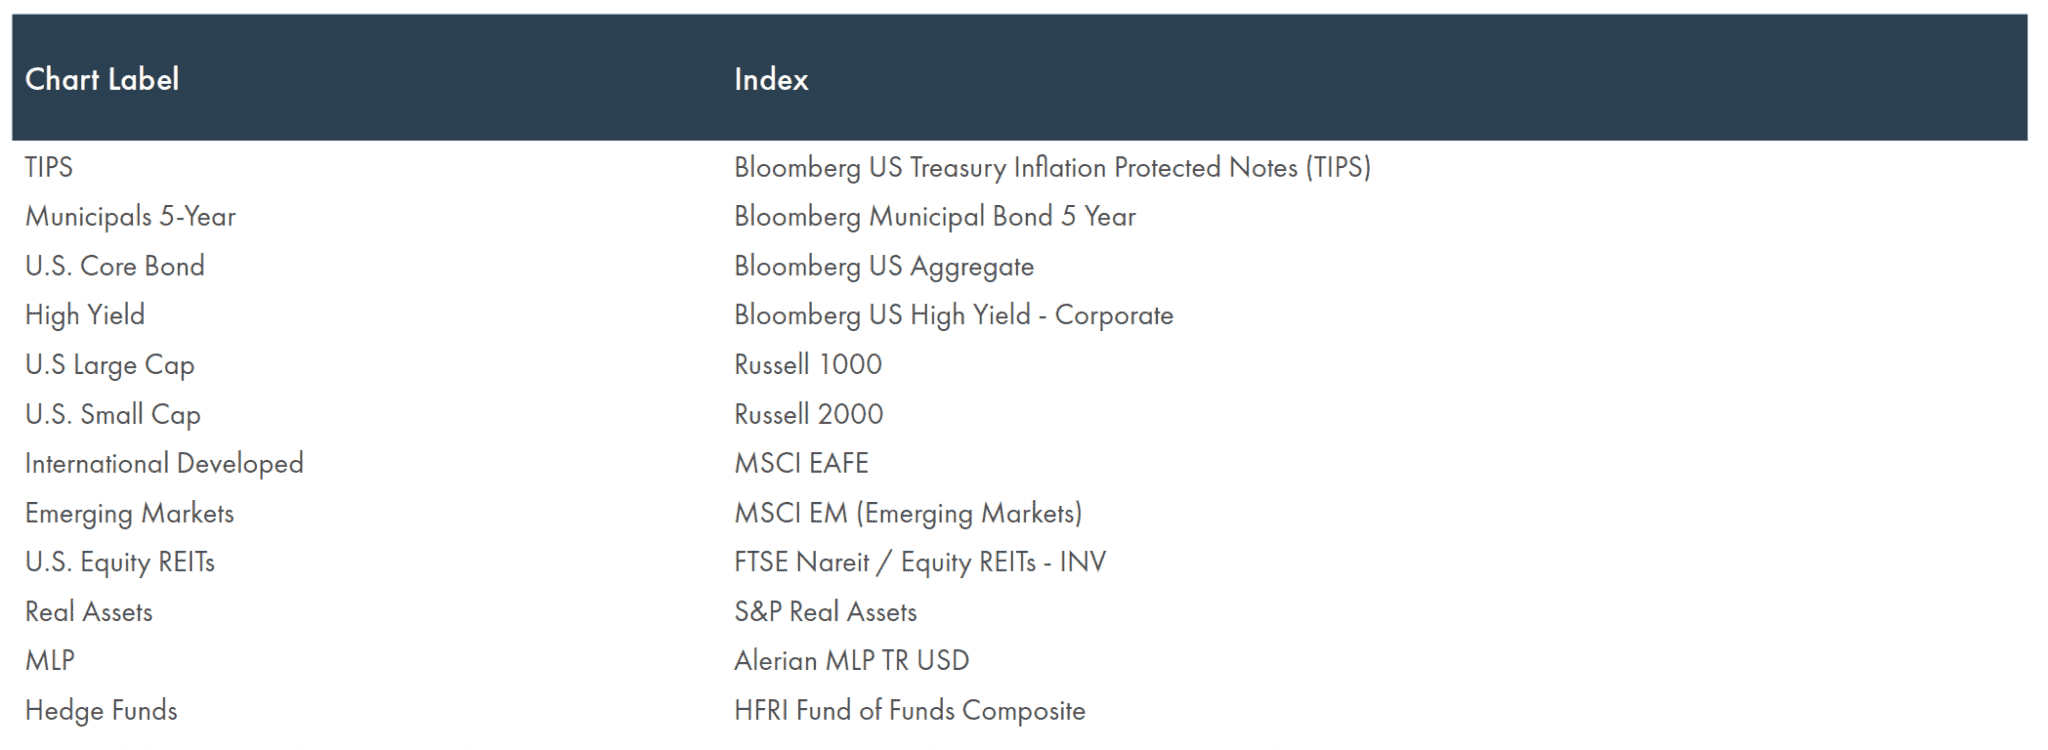
Asset Class Performance – Index Mapping
Definitions
S&P 500 Index: is a free-float capitalization-weighted index of the prices of 500 large-cap common stocks actively traded in the United States.
Markit Composite Purchasing Managers’ Index (PMI): is a weighted average of the Manufacturing Output Index and Services Business Activity Index.
Consumer Price Index for All Urban Consumers: All Items in U.S. City Average, Percent Change from Year Ago, Monthly, Seasonally Adjusted. It is a measure of the average monthly change in the price for goods and services paid by urban consumers between any two time periods. It can also represent the buying habits of urban consumers. This particular index includes roughly 88 percent of the total population, accounting for wage earners, clerical workers, technical workers, self-employed, short-term workers, unemployed, retirees, and those not in the labor force.
Assets: Represents US Treasury securities and mortgage-backed securities held outright by the Federal Reserve. Millions of U.S. Dollars, Weekly, Not Seasonally Adjusted
Job Openings: Total Nonfarm, Level in Thousands, Monthly, Seasonally Adjusted
Hires: Total Nonfarm, Level in Thousands, Monthly, Seasonally Adjusted
Spot Crude Oil Prices: West Texas Intermediate (WTI), Dollars per Barrel, Monthly, Not Seasonally Adjusted
Grayscale Bitcoin Cash Trust (GBTC): managed by Grayscale Advisors, LLC, provides a a secure structure to gain exposure to BTC. Eligible shares are quoted
on the OTCQX®.
Russel 1000® Index: measures the performance of the large-cap segment of the US equity universe. It is a subset of the Russell 3000® Index and includes approximately 1,000 of the largest securities based on a combination of their market cap and current index membership. The Russell 1000 represents approximately 93% of the US market.
Russell Sub-Sector Indices: The Russell sub-sector indices measure the performance of companies in the Russell 1000 index that are specific to the respective sub-sector.
US Treasury Bonds: are government debt securities issued by the U.S. government. The interest rates represent the annual yield provided to an investor for each level of maturity.
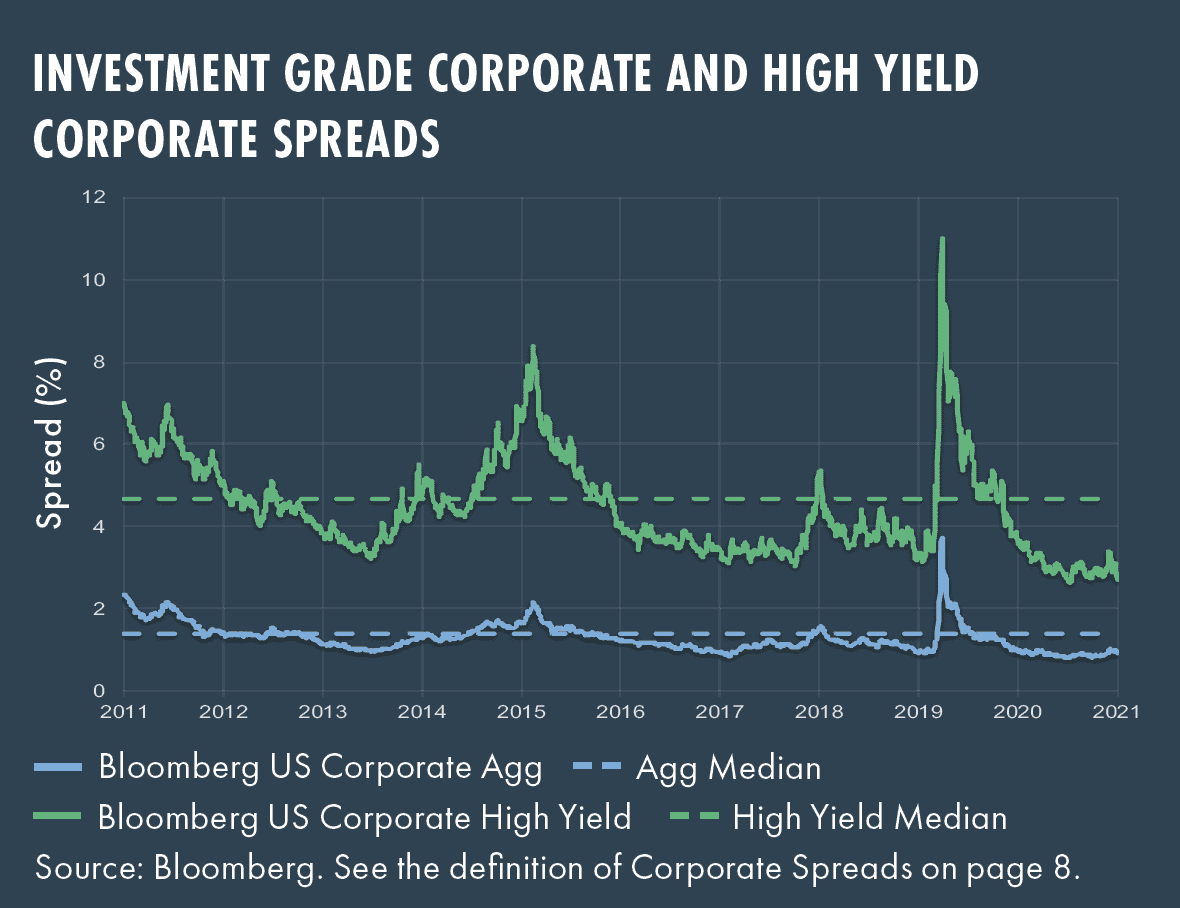
Bloomberg US Agg Corporate Average OAS: The option-adjusted spread (OAS) is the measurement of the spread of a fixed-income security rate and the risk-free rate of return, which is adjusted to take into account an embedded option.
Bloomberg US Corporate High Yield Average OAS: The option-adjusted spread (OAS) is the measurement of the spread of a fixed-income security rate and the risk-free rate of return, which is adjusted to take into account an embedded option.
©2022, Moneta Group Investment Advisors, LLC. Trademarks and copyrights of materials referenced herein are the property of their respective owners. These materials have been prepared for informational purposes only based on materials deemed reliable, but the accuracy of which has not been verified. Past performance is not indicative of future returns. You cannot invest directly in an index. These materials do not constitute an offer or recommendation to buy or sell securities, and do not take into consideration your circumstances, financial or otherwise. You should consult with an appropriately credentialed investment professional before making any investment decision.