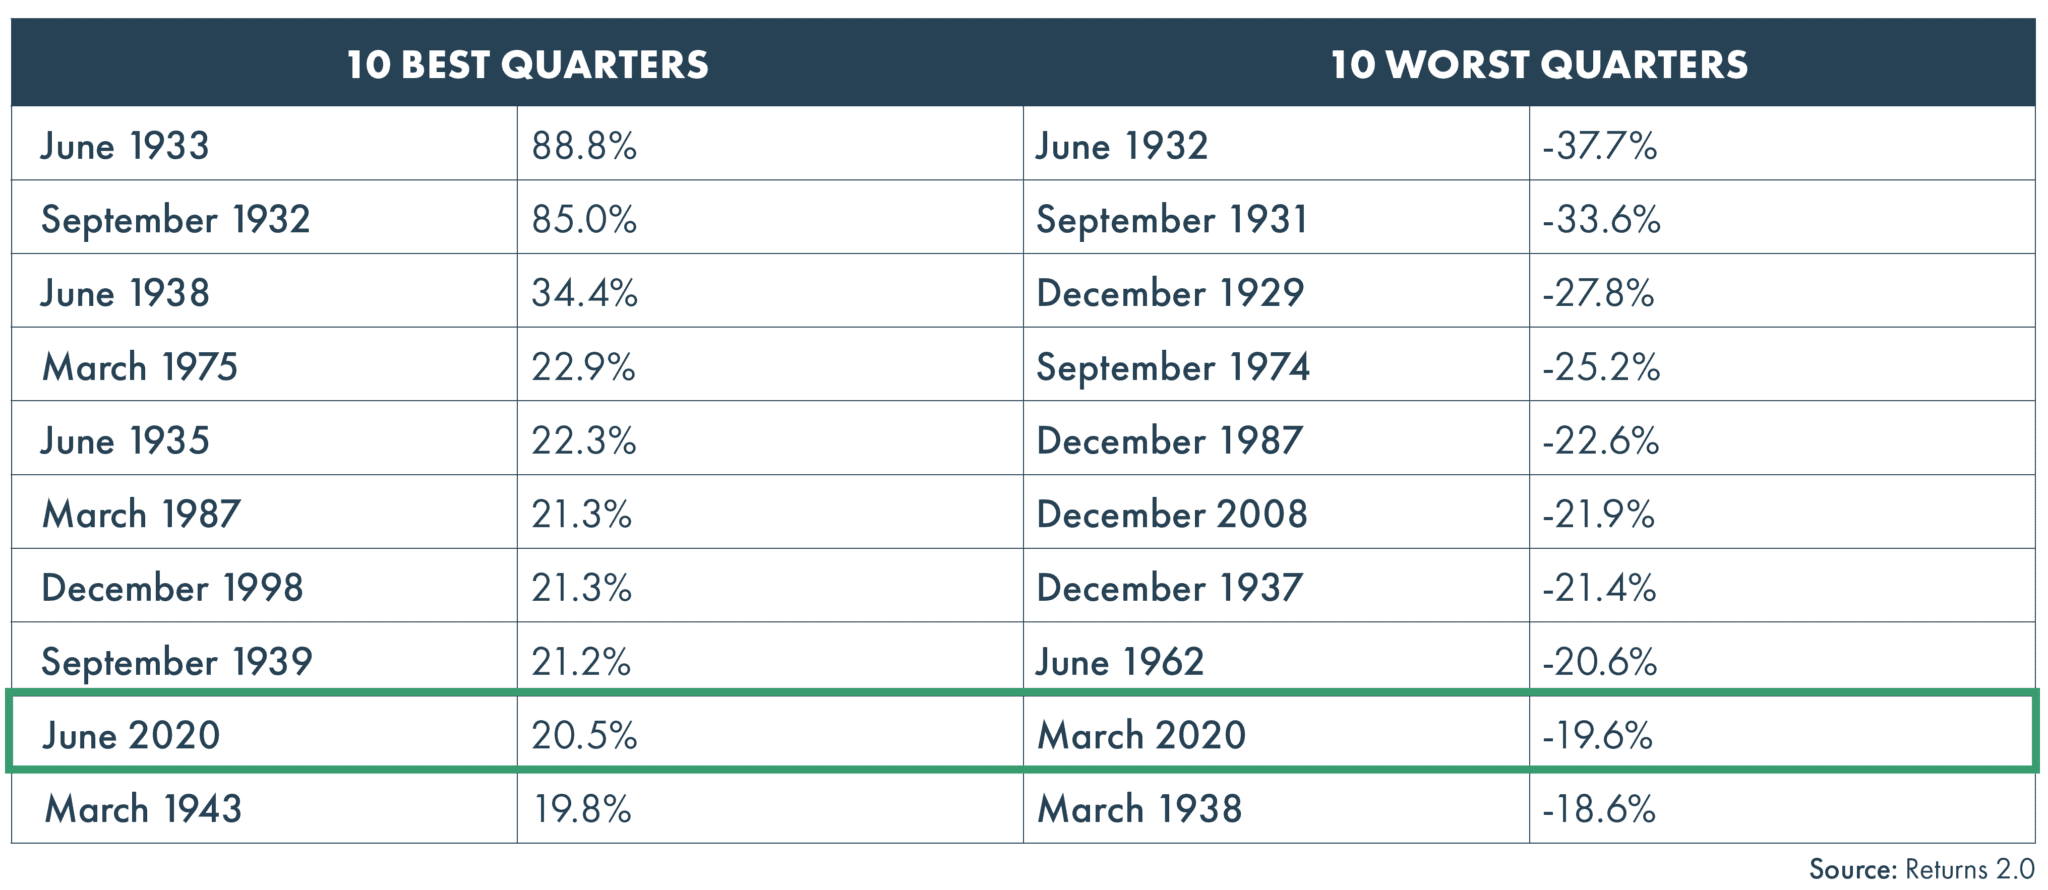
We are only halfway through 2020 and already it has been one of the most unique investing years in memory. If the biggest surprise of Q1 was the speed and depth of the decline of economic activity in the ‘forced’ recession, the biggest surprise of Q2 was the strength of the rebound as the economy began to reopen. The S&P 500, and Russell 2000 added 20.5% and 25.4% respectively, and every asset class and market segment we track posted a positive return for the three months. The first quarter of the year was so bad, and the second quarter of the year was so good that both fall into the top 10 for the best/worst quarters since 1926.
Top 10 Best and Worst Market Performance Quarters
Better, but Not Great
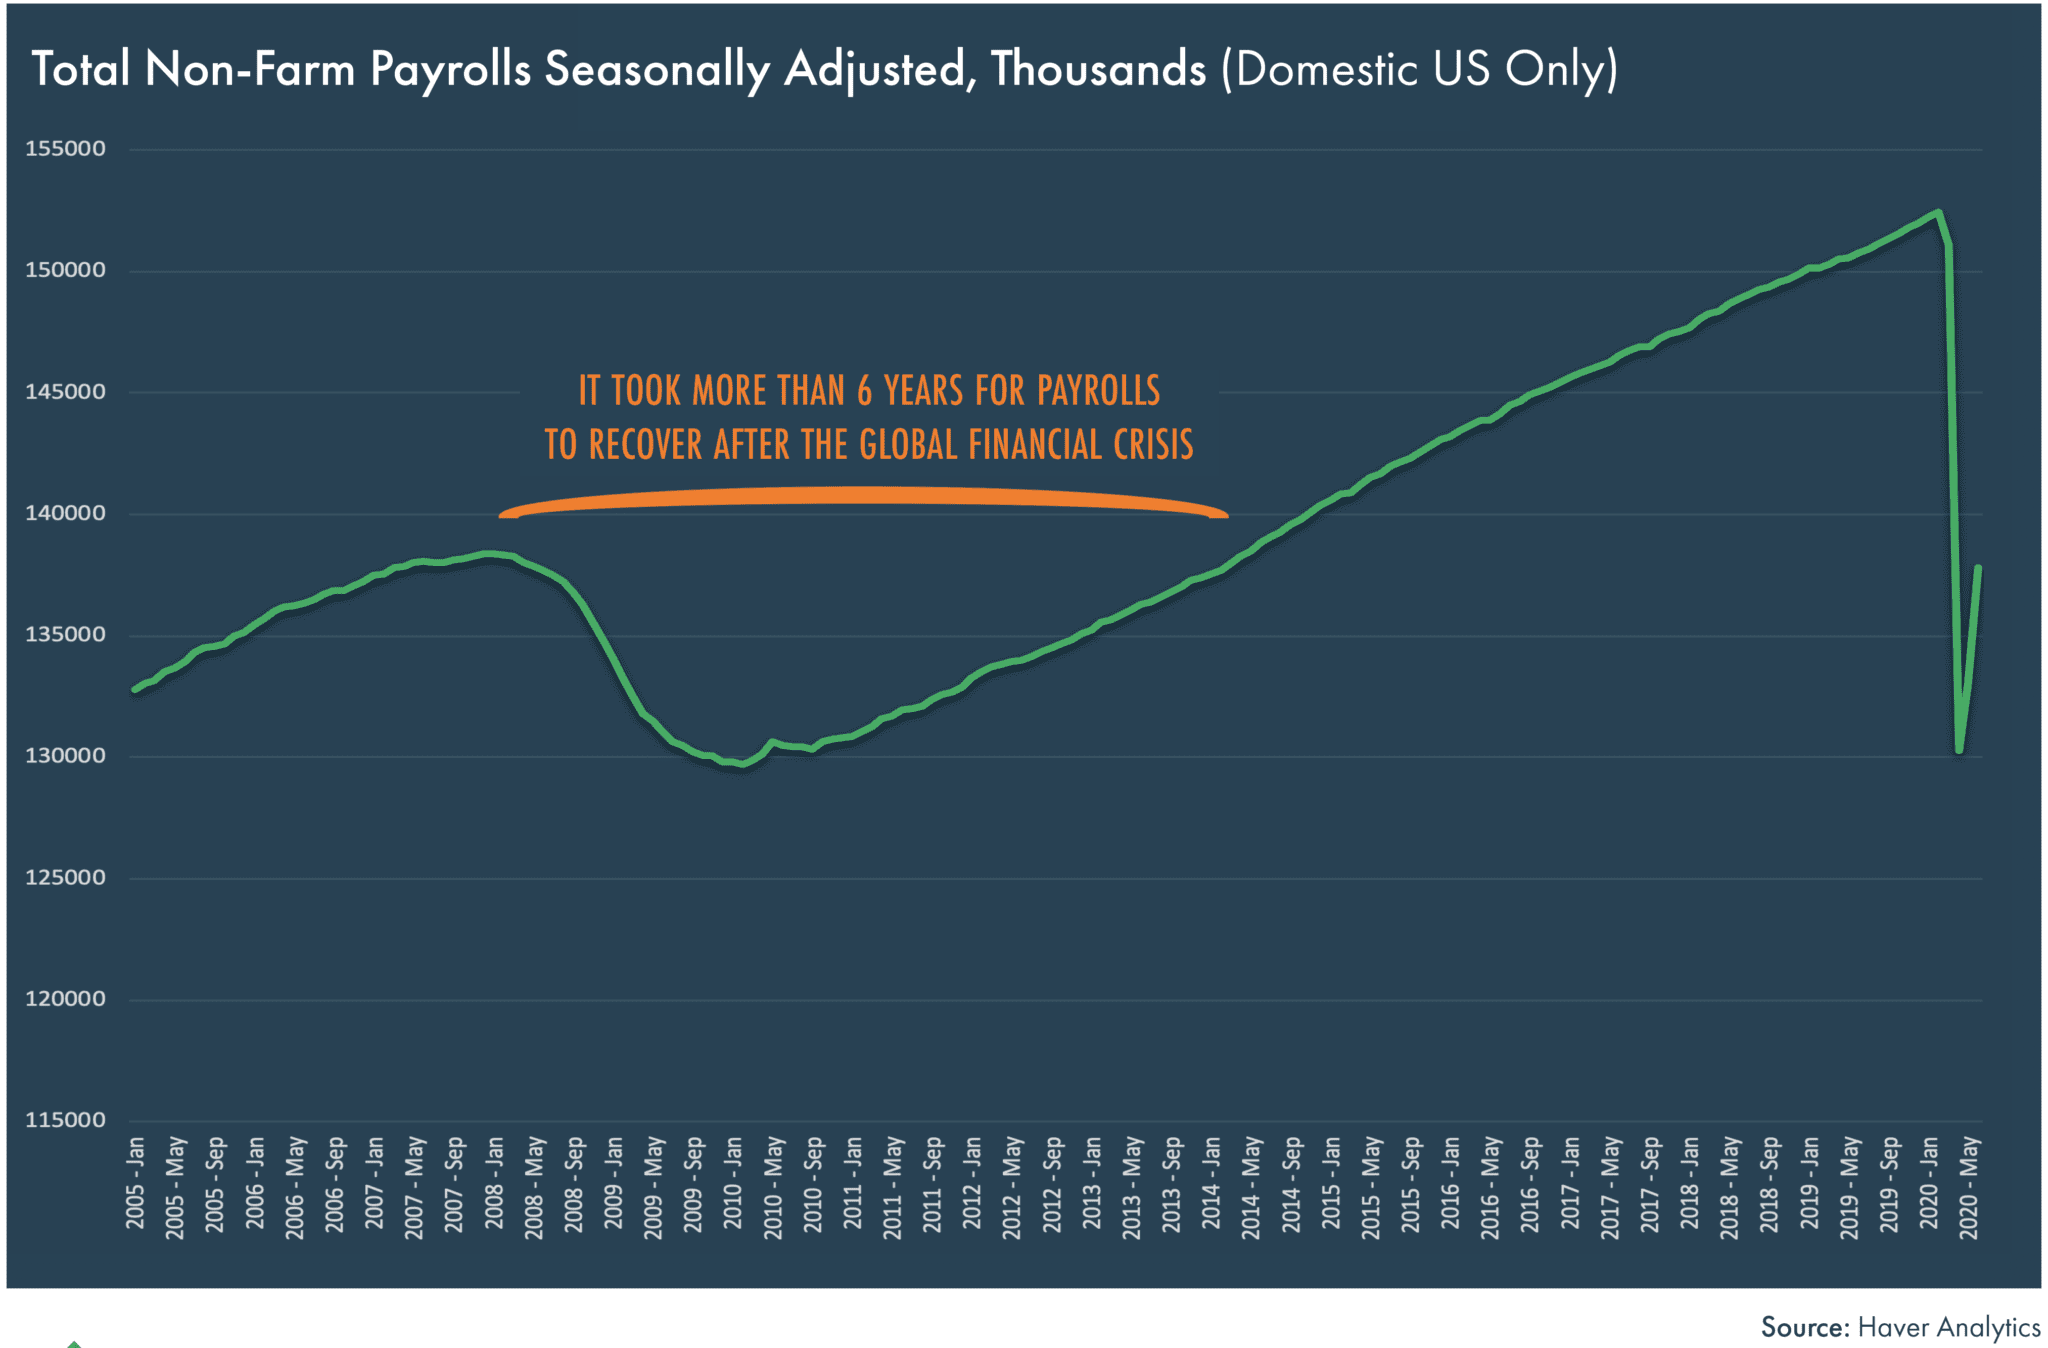
Economic activity also rebounded along with the markets in the second quarter. While the economy has and is improving, history suggests that it will be some time before it is back at the peak levels seen prior to COVID-19. The chart below shows total non-farm payrolls over the past fifteen years. One can clearly see the decline and recovery from the Global Financial Crisis and the much steeper decline from the pandemic. Most other major economic indicators show a similar pattern; things are better, but not great.
Many Market “Unknowns” for the Remainder of 2020
The markets face other challenges and could see more before year end. So much remains unknown about the virus and a resurgence could take on a life of its own. We face a very contentious presidential election in just a little over three months, and we remain caught in the moment of a great social debate and accompanying civil unrest.
Despite the challenges, the S&P 500 is positive year-to-date (as of late July), and the NASDAQ has touched record high levels in recent sessions. Not all sectors of the market have responded equally; on a year-to-date basis, growth has outperformed value by a wide margin, large cap has outperformed small- and mid-cap, and technology stocks have been the strongest sector.
In our opinion, markets have rebounded based on two major factors. First, return-seeking investors have been ‘forced’ into stocks because of the extraordinarily low cash and bond yields and the guidance from the Fed that short-term rates will stay at zero for the foreseeable future. Second, it seems the market is discounting better days ahead based upon the following assumptions:
- Pent up demand exists, the government stimulus (and expectations of more to come) placed a base under the economy from which the recovery will start.
- Businesses and consumers were not overextended entering the recession.
- The virus continues to pose the biggest threat to the economy, but global fiscal and monetary policy is extraordinarily stimulative, reminding us of the old adage, “Don’t fight the Fed.”
A couple of characteristics of this bull market that have caught our eye are the concentration of the S&P 500 market capitalization in just five stocks (Apple, Amazon, Microsoft, Google and Facebook make up almost 22% of the S&P 500) and the large divergence between growth and value (almost 30% year-to-date in large cap). While we do not know when these trends will end, we do know that bear markets often end with a rotation in markets’ leaders. Examples from history include the rotation from tech stocks to the outperformance of value after the Tech Wreck and the dramatic underperformance of financials after the Global Financial Crisis. Thinking about the markets through the eyes of a contrarian and within the context of ‘price matters,’ a few recent themes that appear to be ripe for potential reversal include:
- International vs. domestic – The strength of the U.S. dollar as well as differences in sector weightings have led to noticeable outperformance of U.S stocks vs. international. Domestic indices tend to be more heavily weighted towards technology than developed market international indices. The dollar could also come under pressure dependent on monetary and fiscal policy responses to the global pandemic.
- Growth vs. value – Growth has persistently outperformed value since the Global Financial Crisis (GFC), a trend that accelerated the last 18 months as investors sought the relative safety of growth stocks in preparation for a recession. On a valuation basis, our work suggests that value in general trades at below average valuations while growth (and large growth in particular) trades at above average valuations.
- Small cap vs. large cap – The Russell 2000 small cap index has outperformed the S&P 500 large cap index since the market lows in late March. This is often a sign of better economic conditions ahead.
In light of these possibilities, instead of trying to time the market, we would continue with the time-proven strategy of maintaining diversification by both asset class (i.e. stocks and bonds) and by size, style and geography within the equity allocation. While we believe in mean reversion, the theory that asset prices and historical returns eventually will revert to the average level of the entire dataset, and that recent trends won’t last forever, attempting to time these shifts is difficult if not impossible.
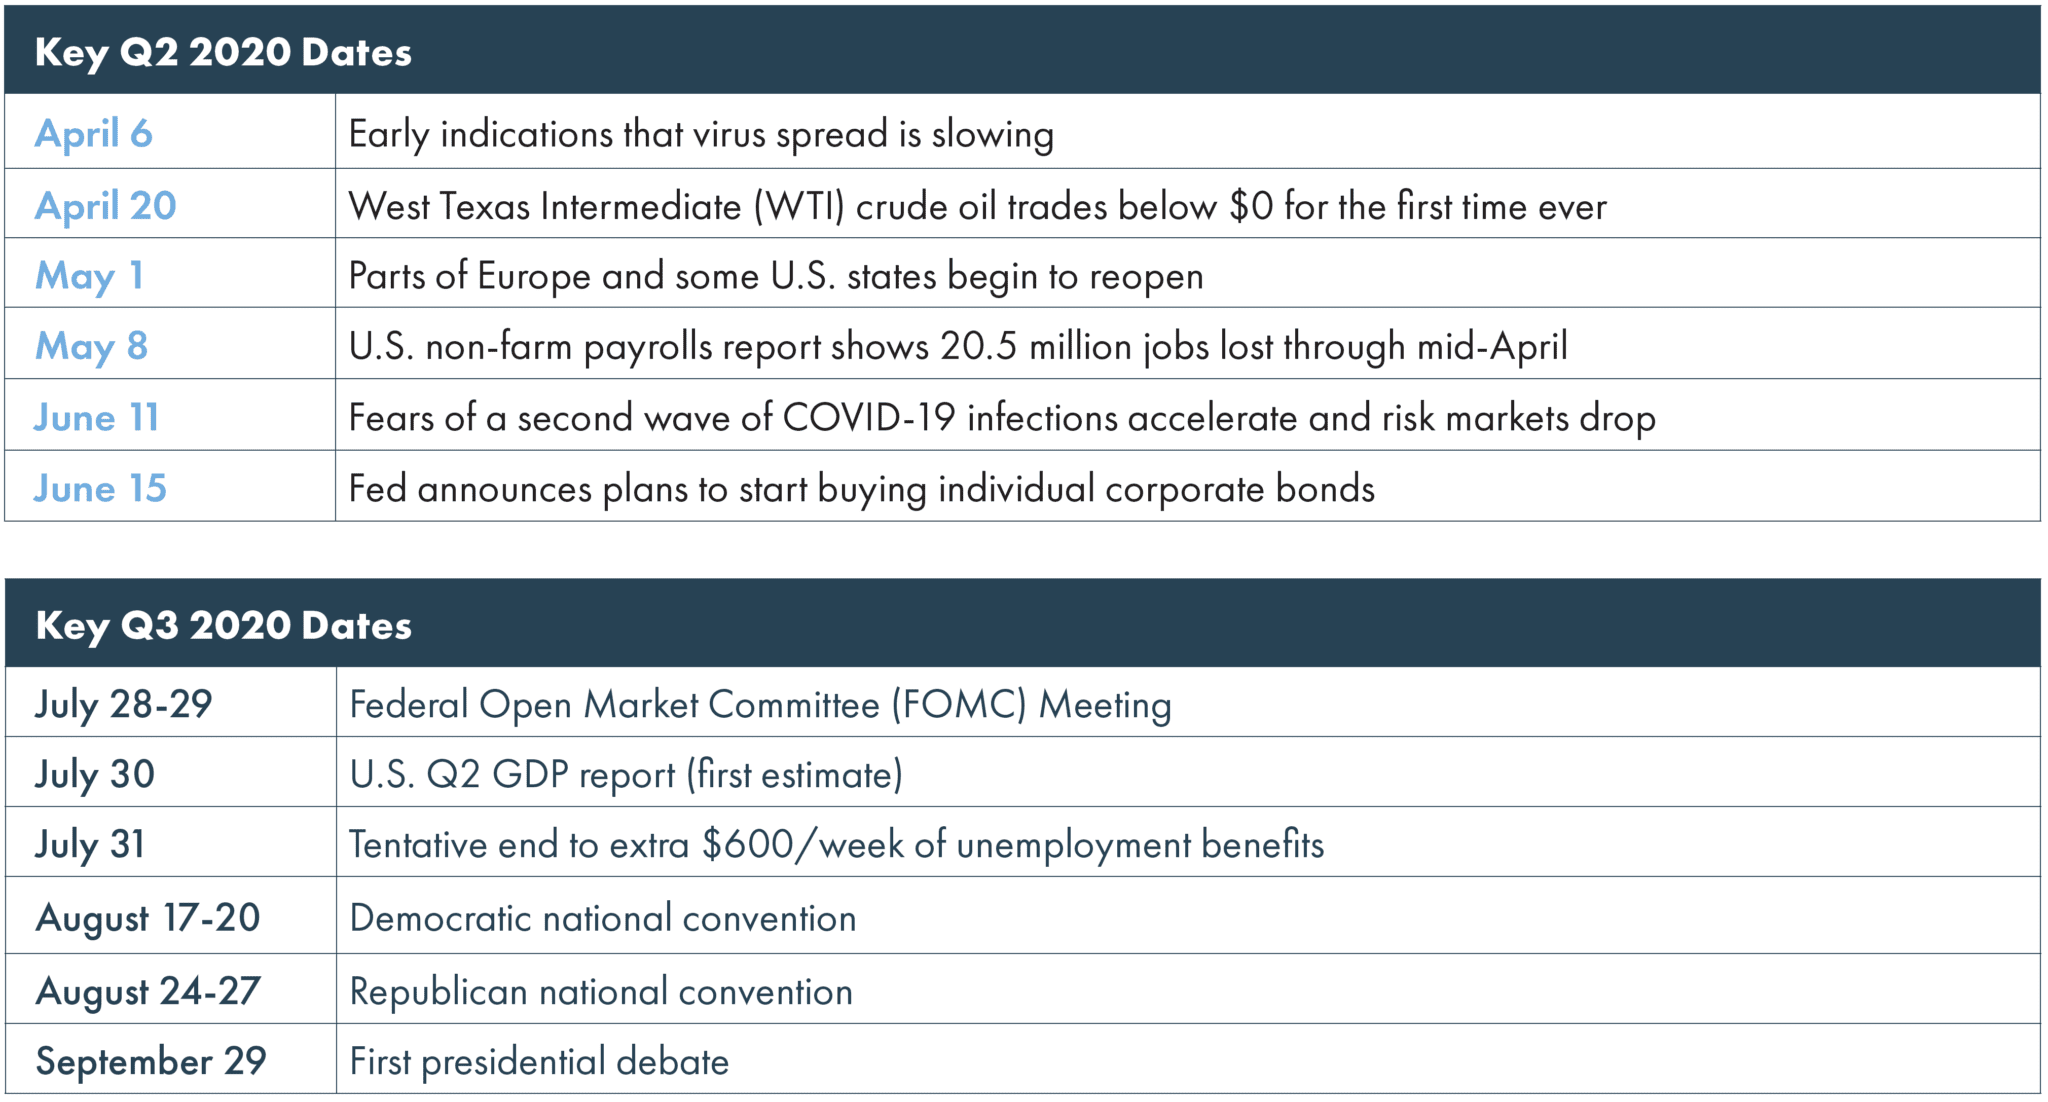
Q2 & Q3 2020 Market Events
 Asset Class Performance Q2 2020
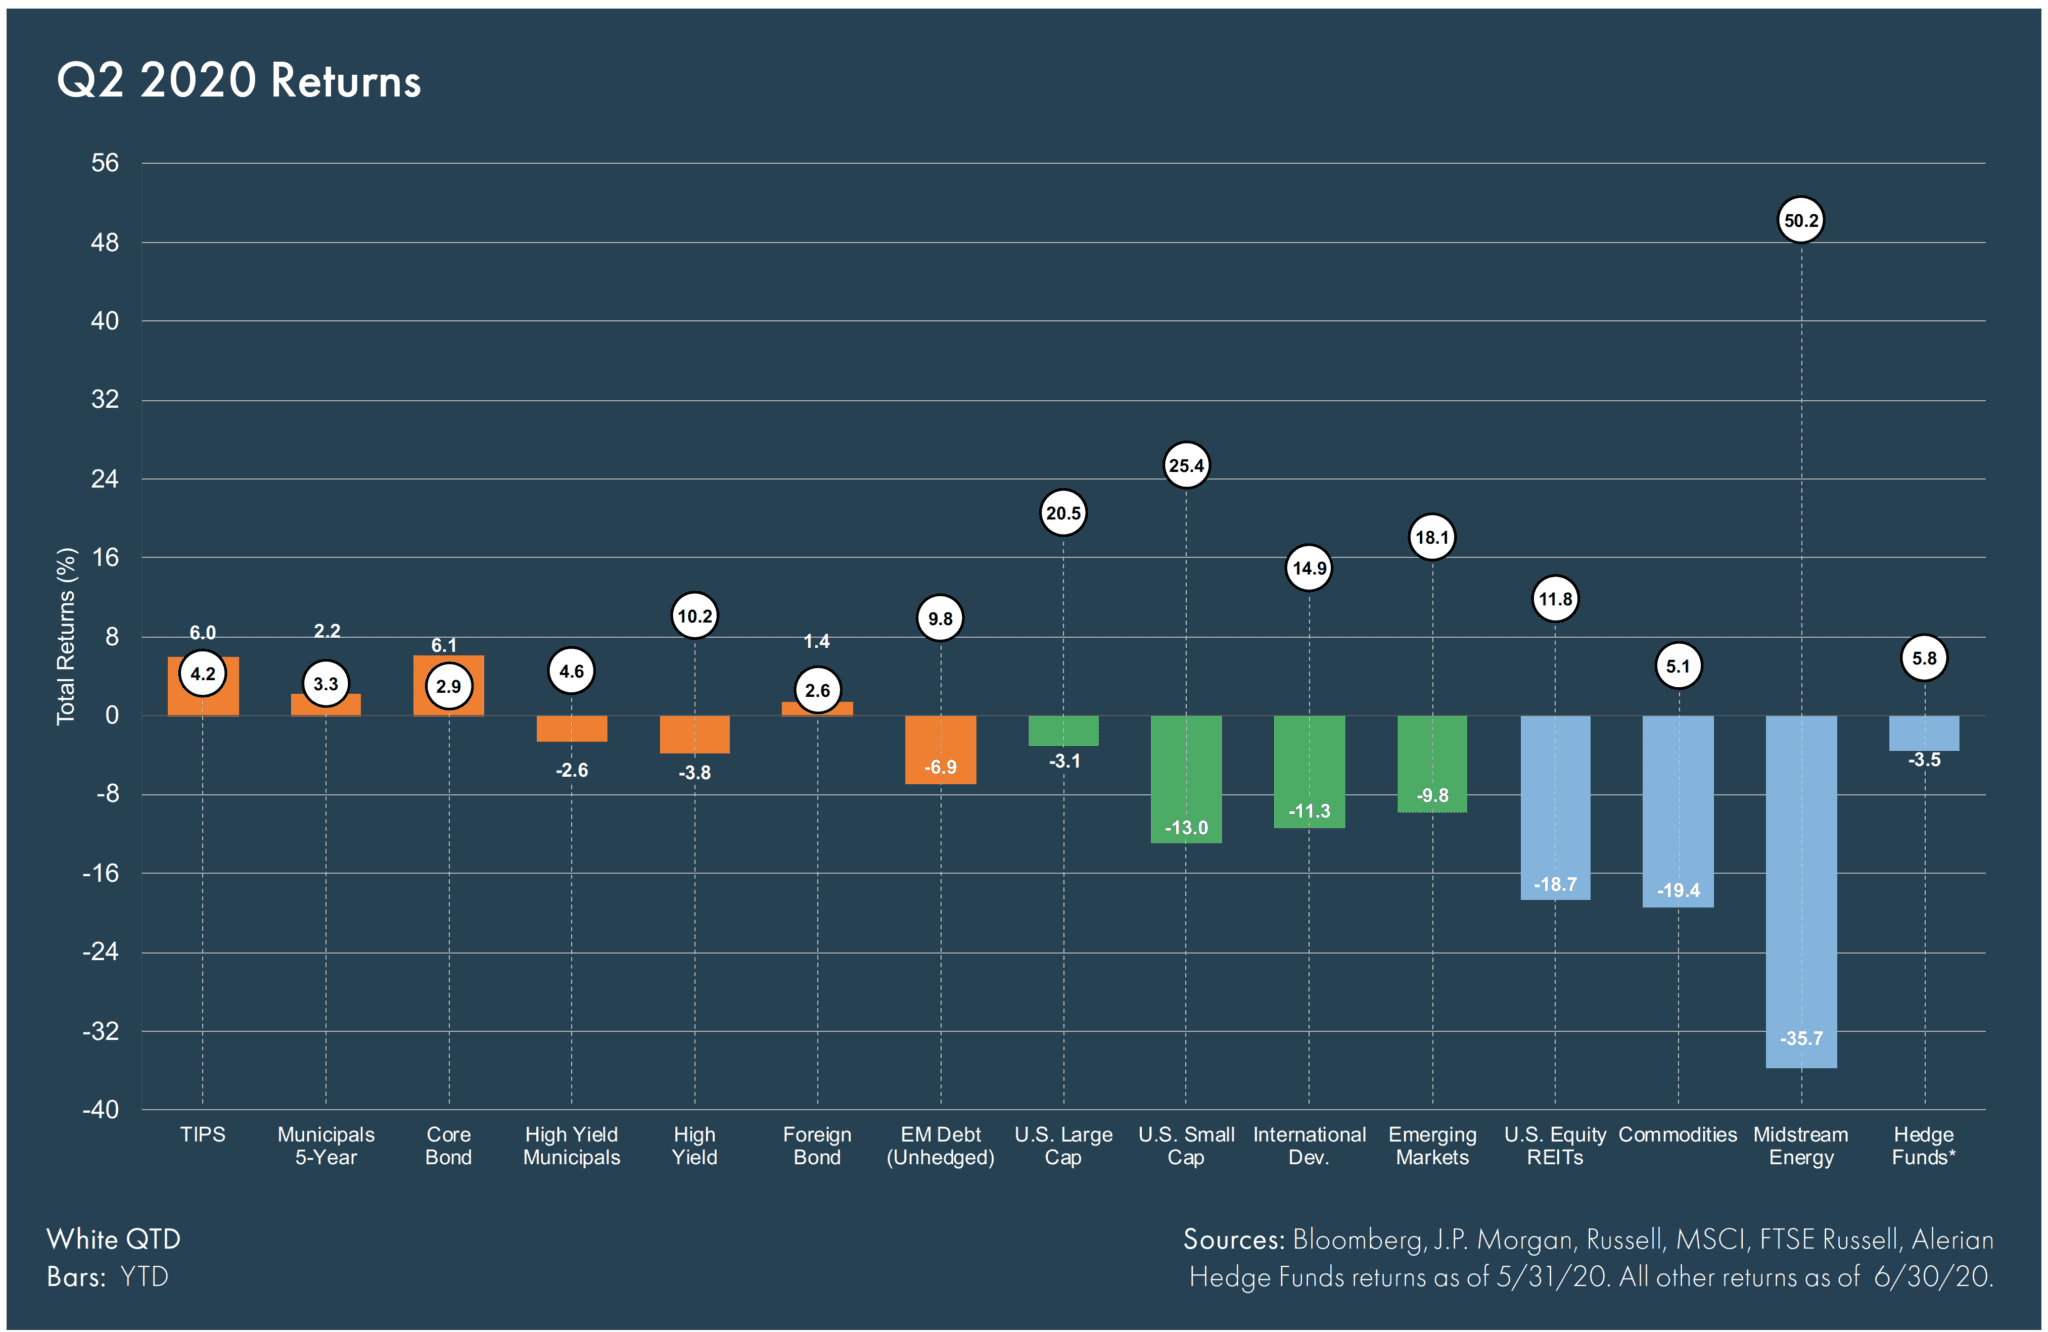

Fixed Income
+ Stable Treasury rates + Risk-on tone benefitted spread sectors + Fed’s credit facilities
Equities
+ Reopening optimism + Rebound in some business activity + Fiscal and monetary policy response to the global pandemic
Alternatives
+ Oil price rebound in May and June + Lower and more stable interest rates benefitted real estate
Market Themes
Graphic Data Represented As of 6/30/2020
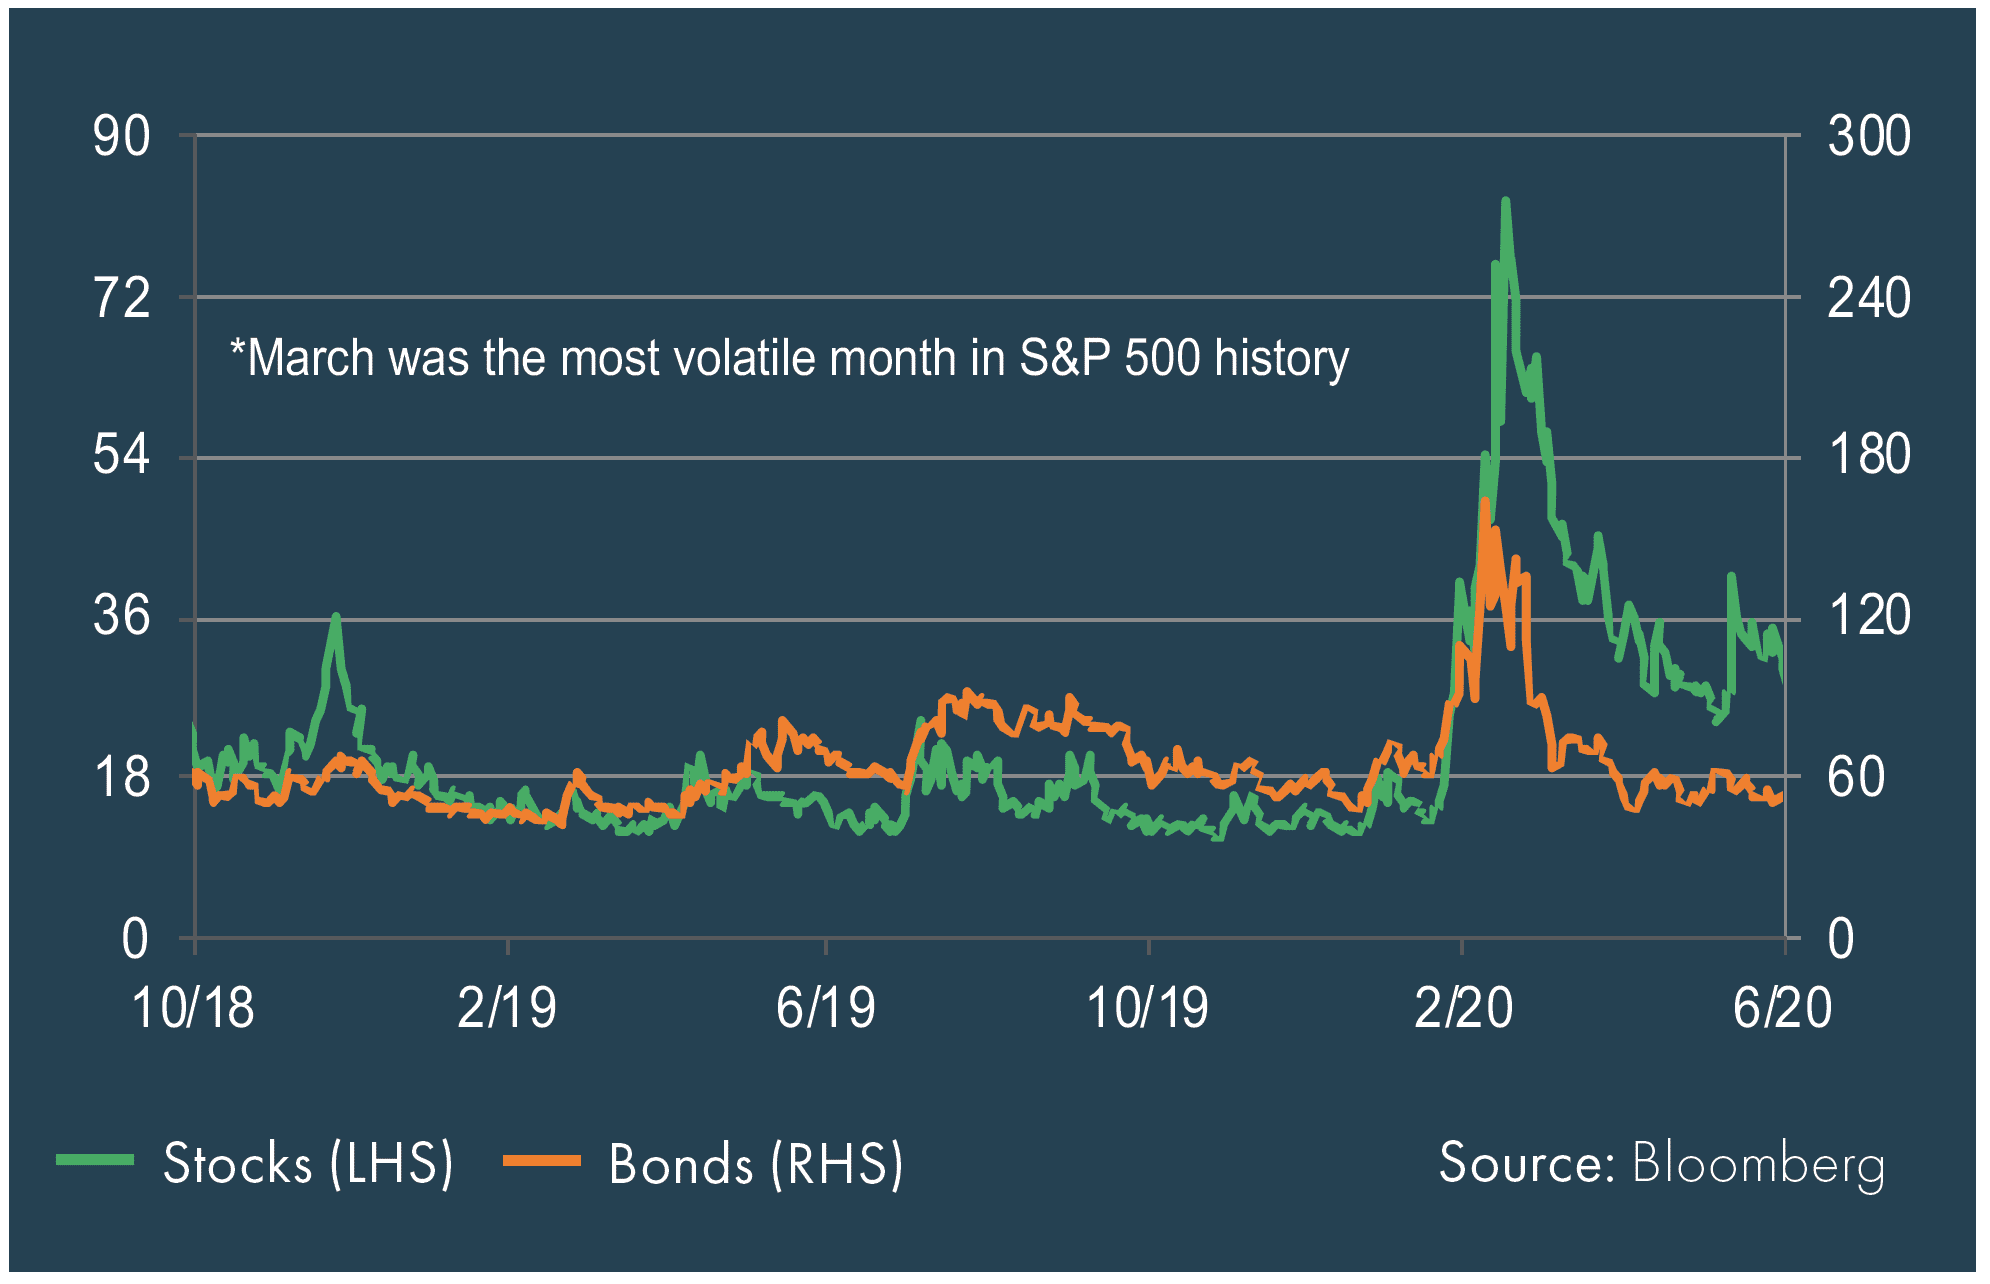
Volatility – Stocks (VIX) and Bonds (MOVE)
Volatility levels fell from March peaks but remain elevated for equities amid continued COVID-19 uncertainty.
WTI Crude Oil Prices
Oil futures contracts fell to an all-time low of -$38 on April 20th but rallied back to a positive but still depressed level around $40 per barrel.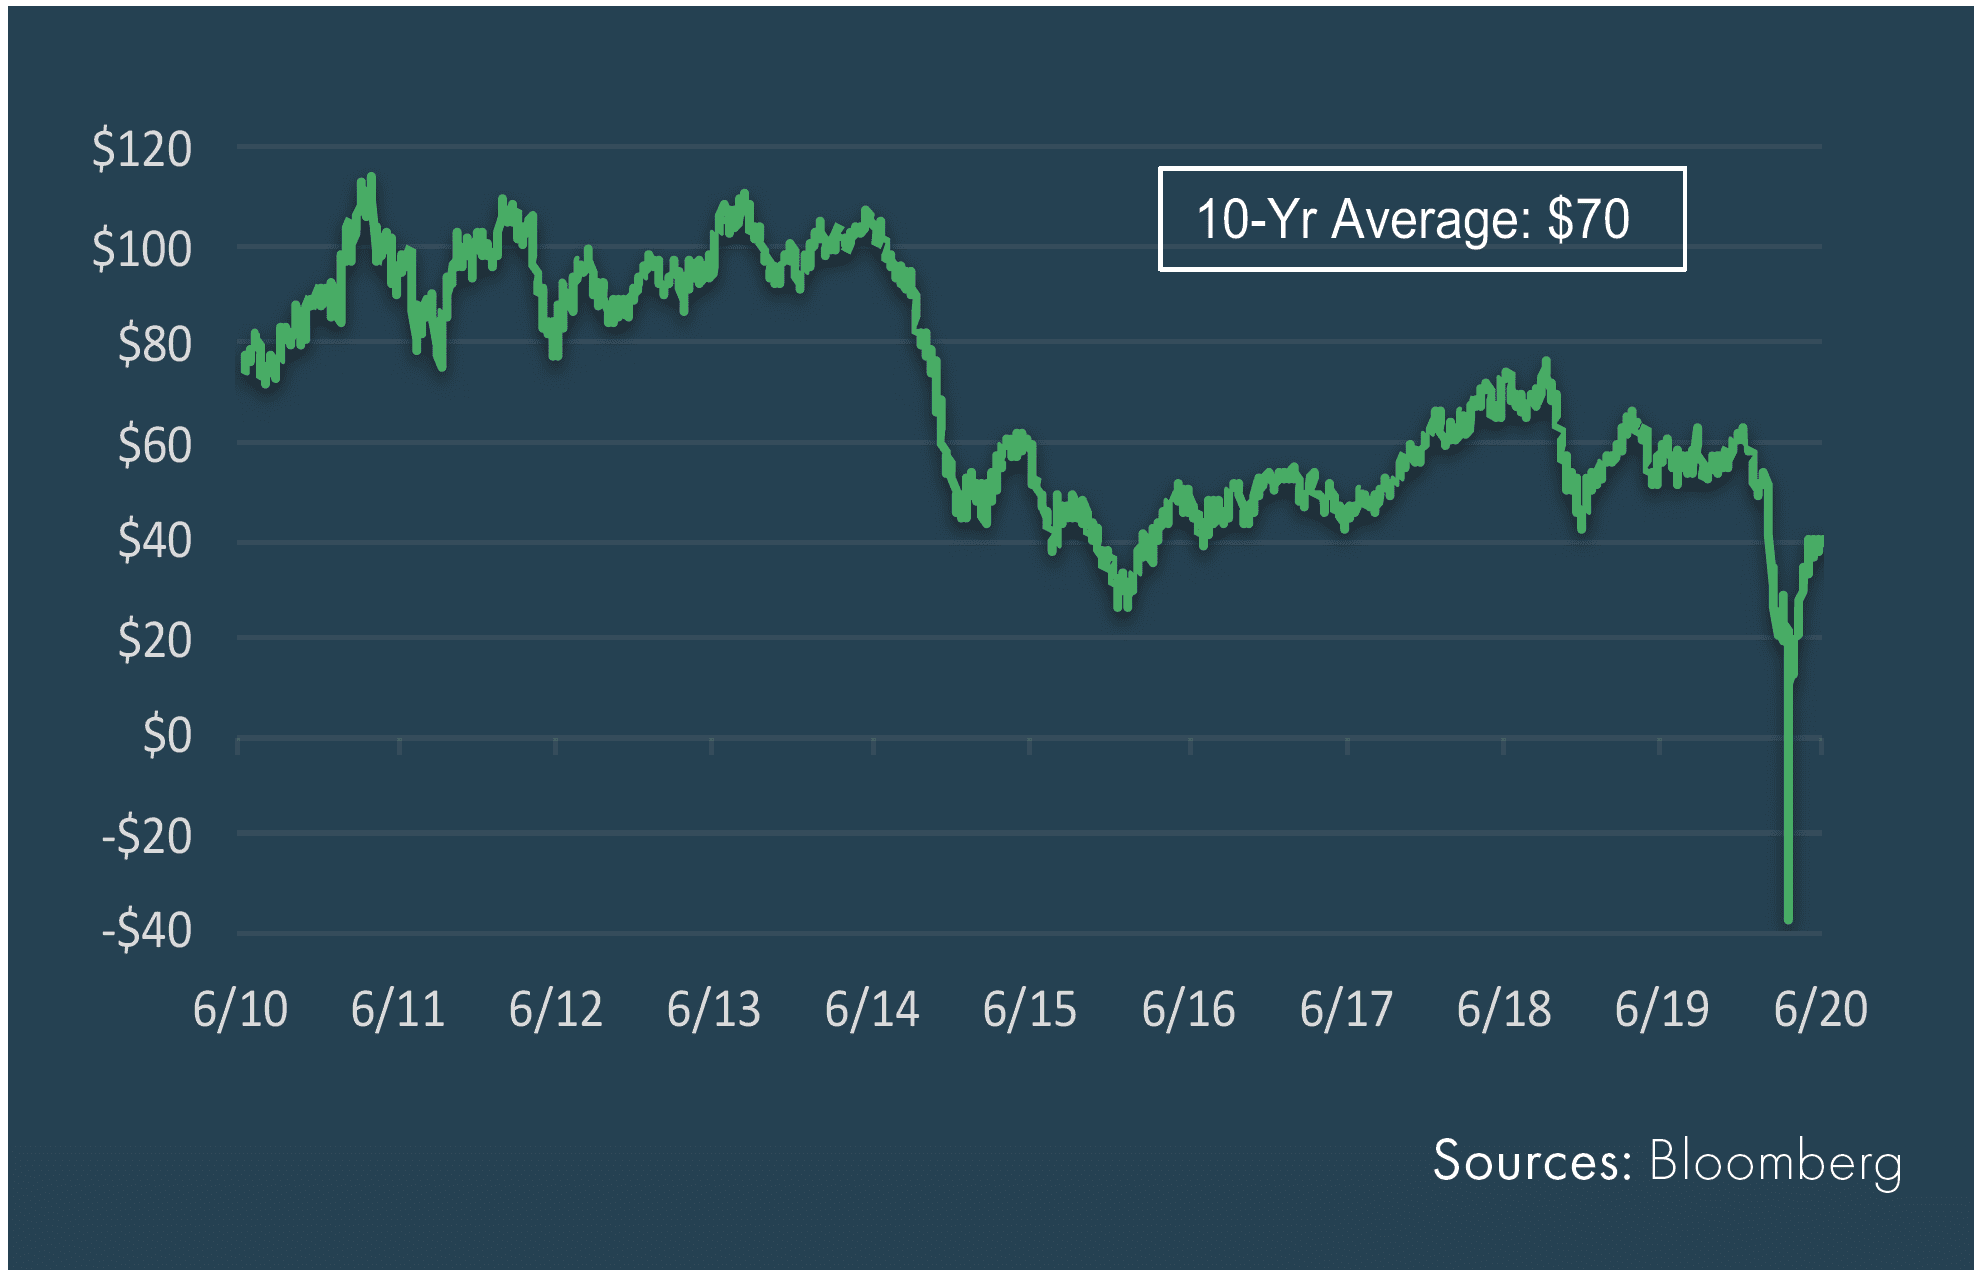
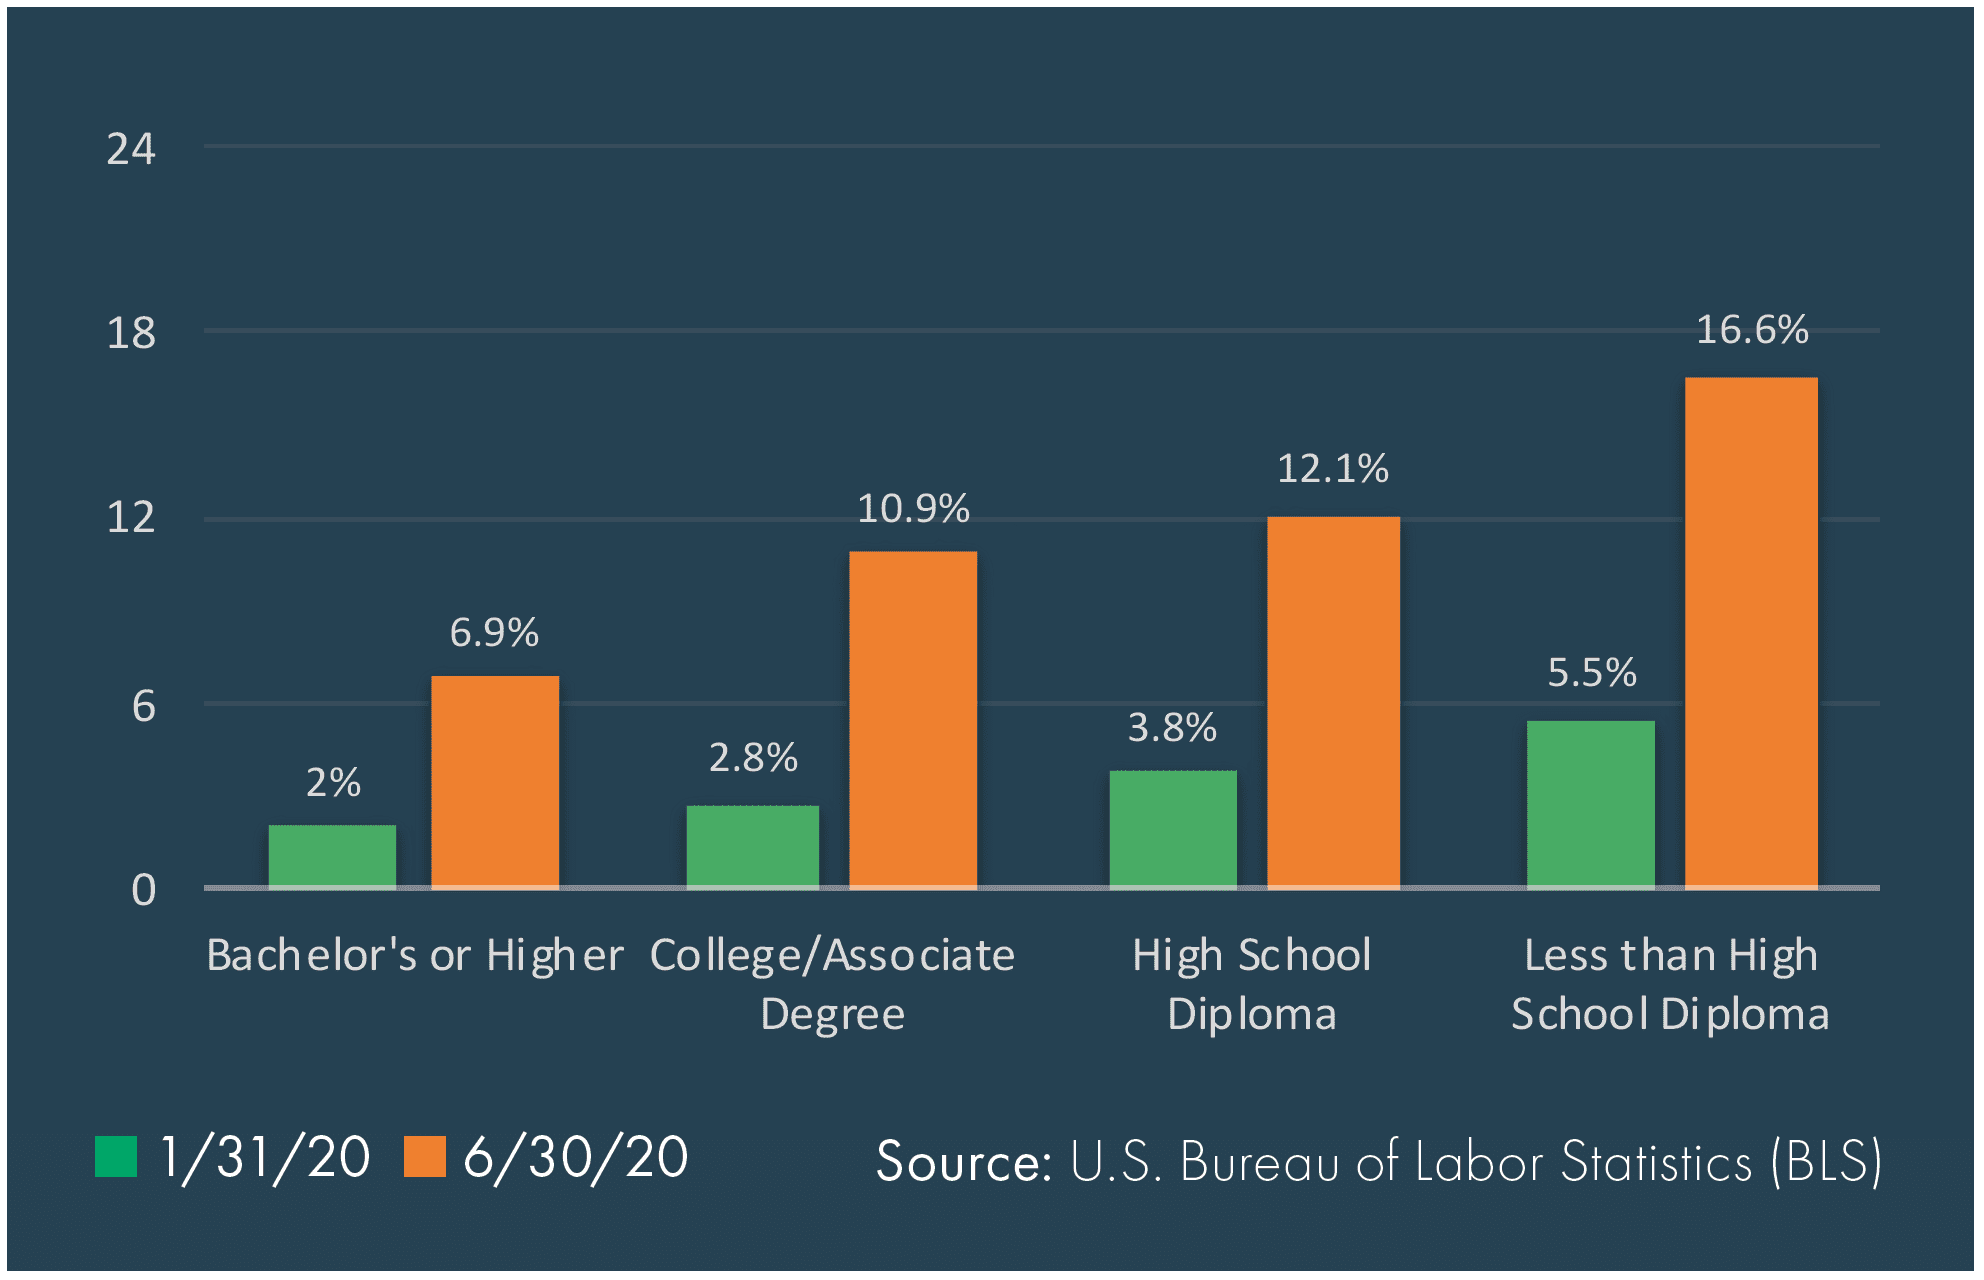
U.S. Unemployment Rate by Education Level (%)
Job losses spiked in the second quarter, notably for those less-educated that comprise a majority of the service-related industry workforce.
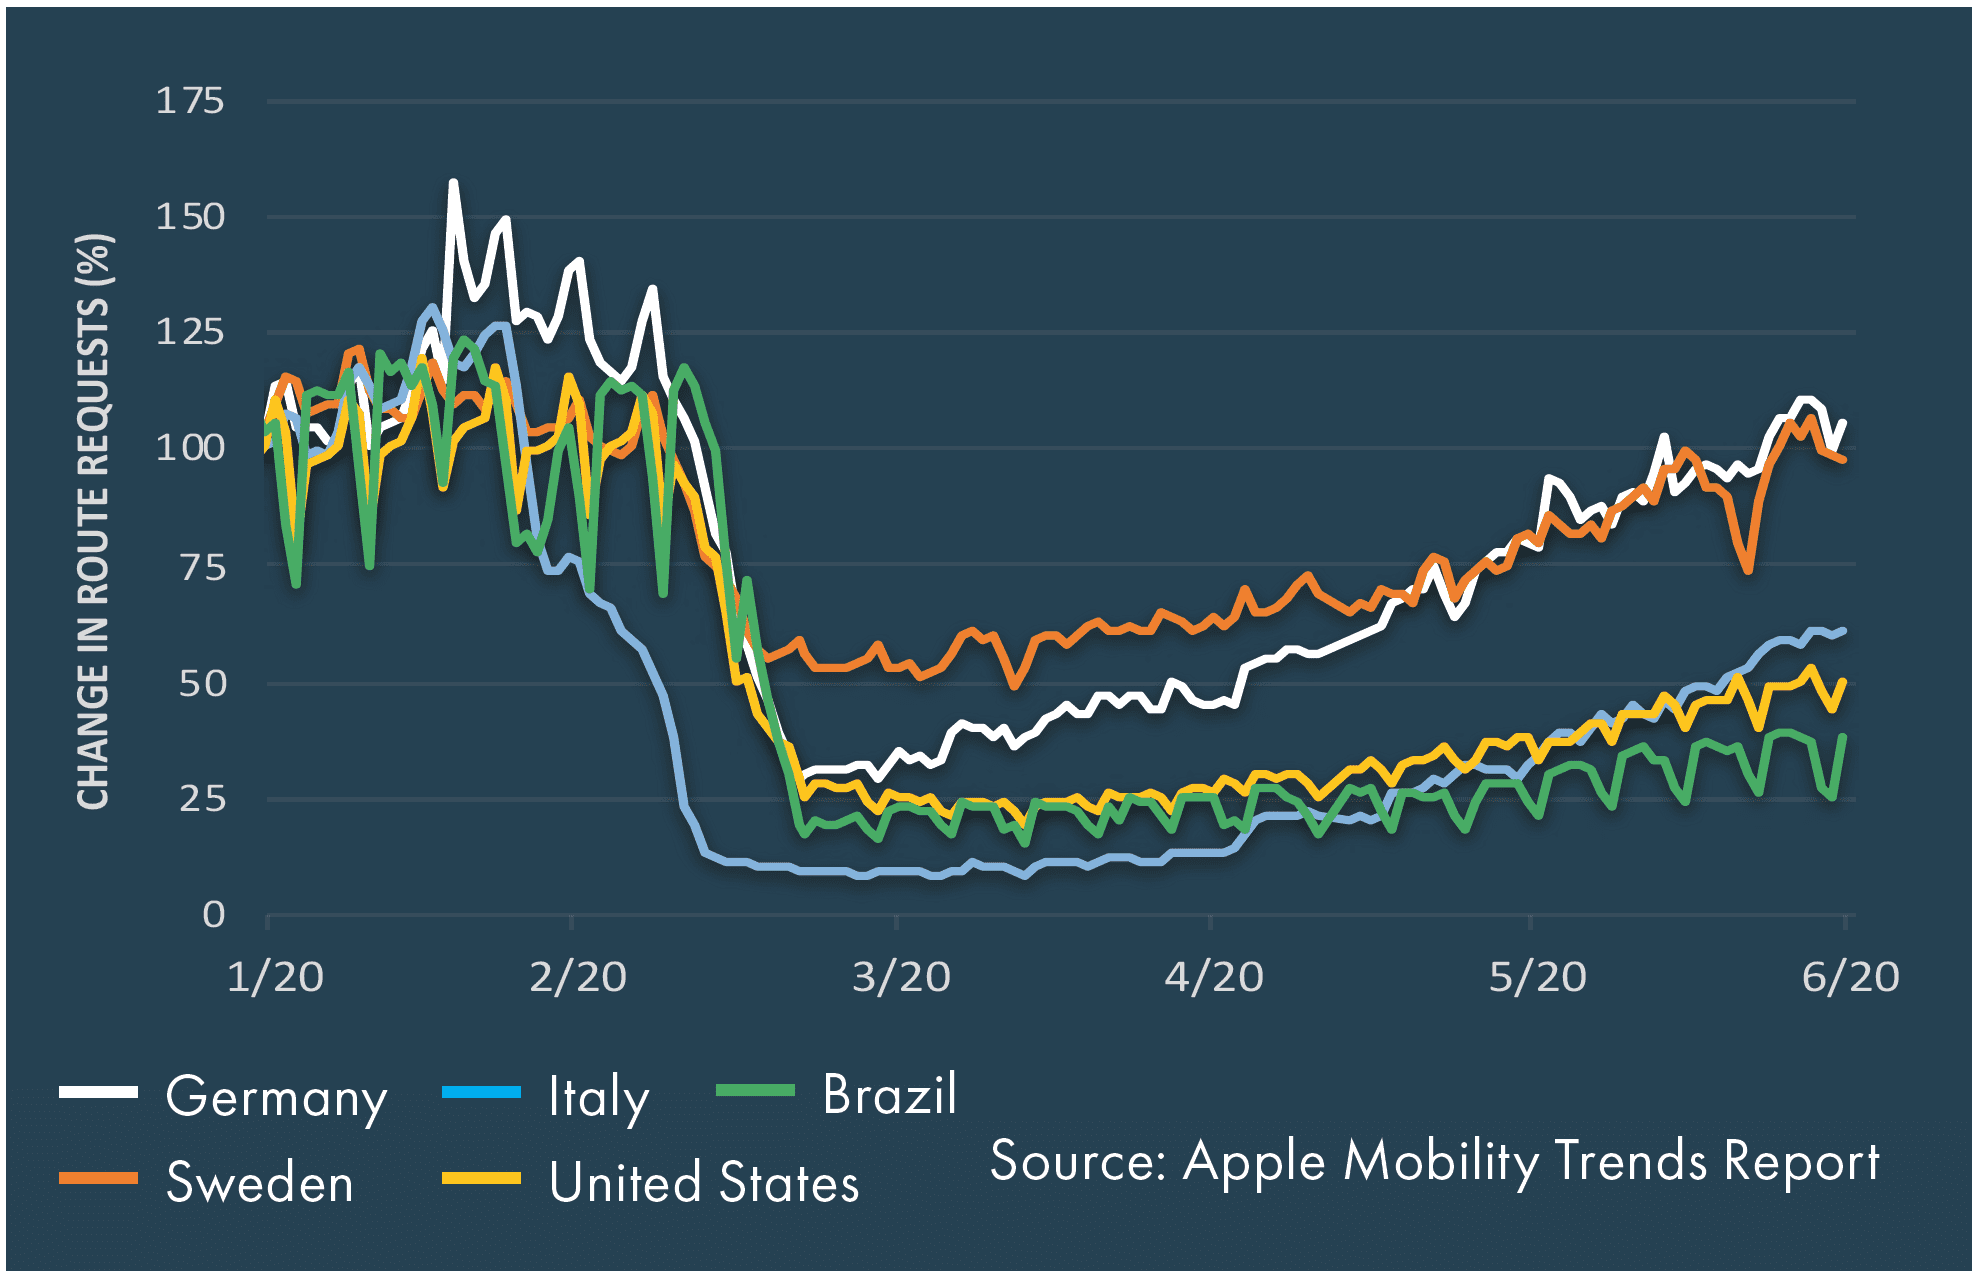
Change in Apple Maps Route Requests (Public Transit)
Reopening measures and the implications on economic activity remain a key focus with several European countries leading the way.
Market Themes
Graphic Data Represented As of 6/30/2020
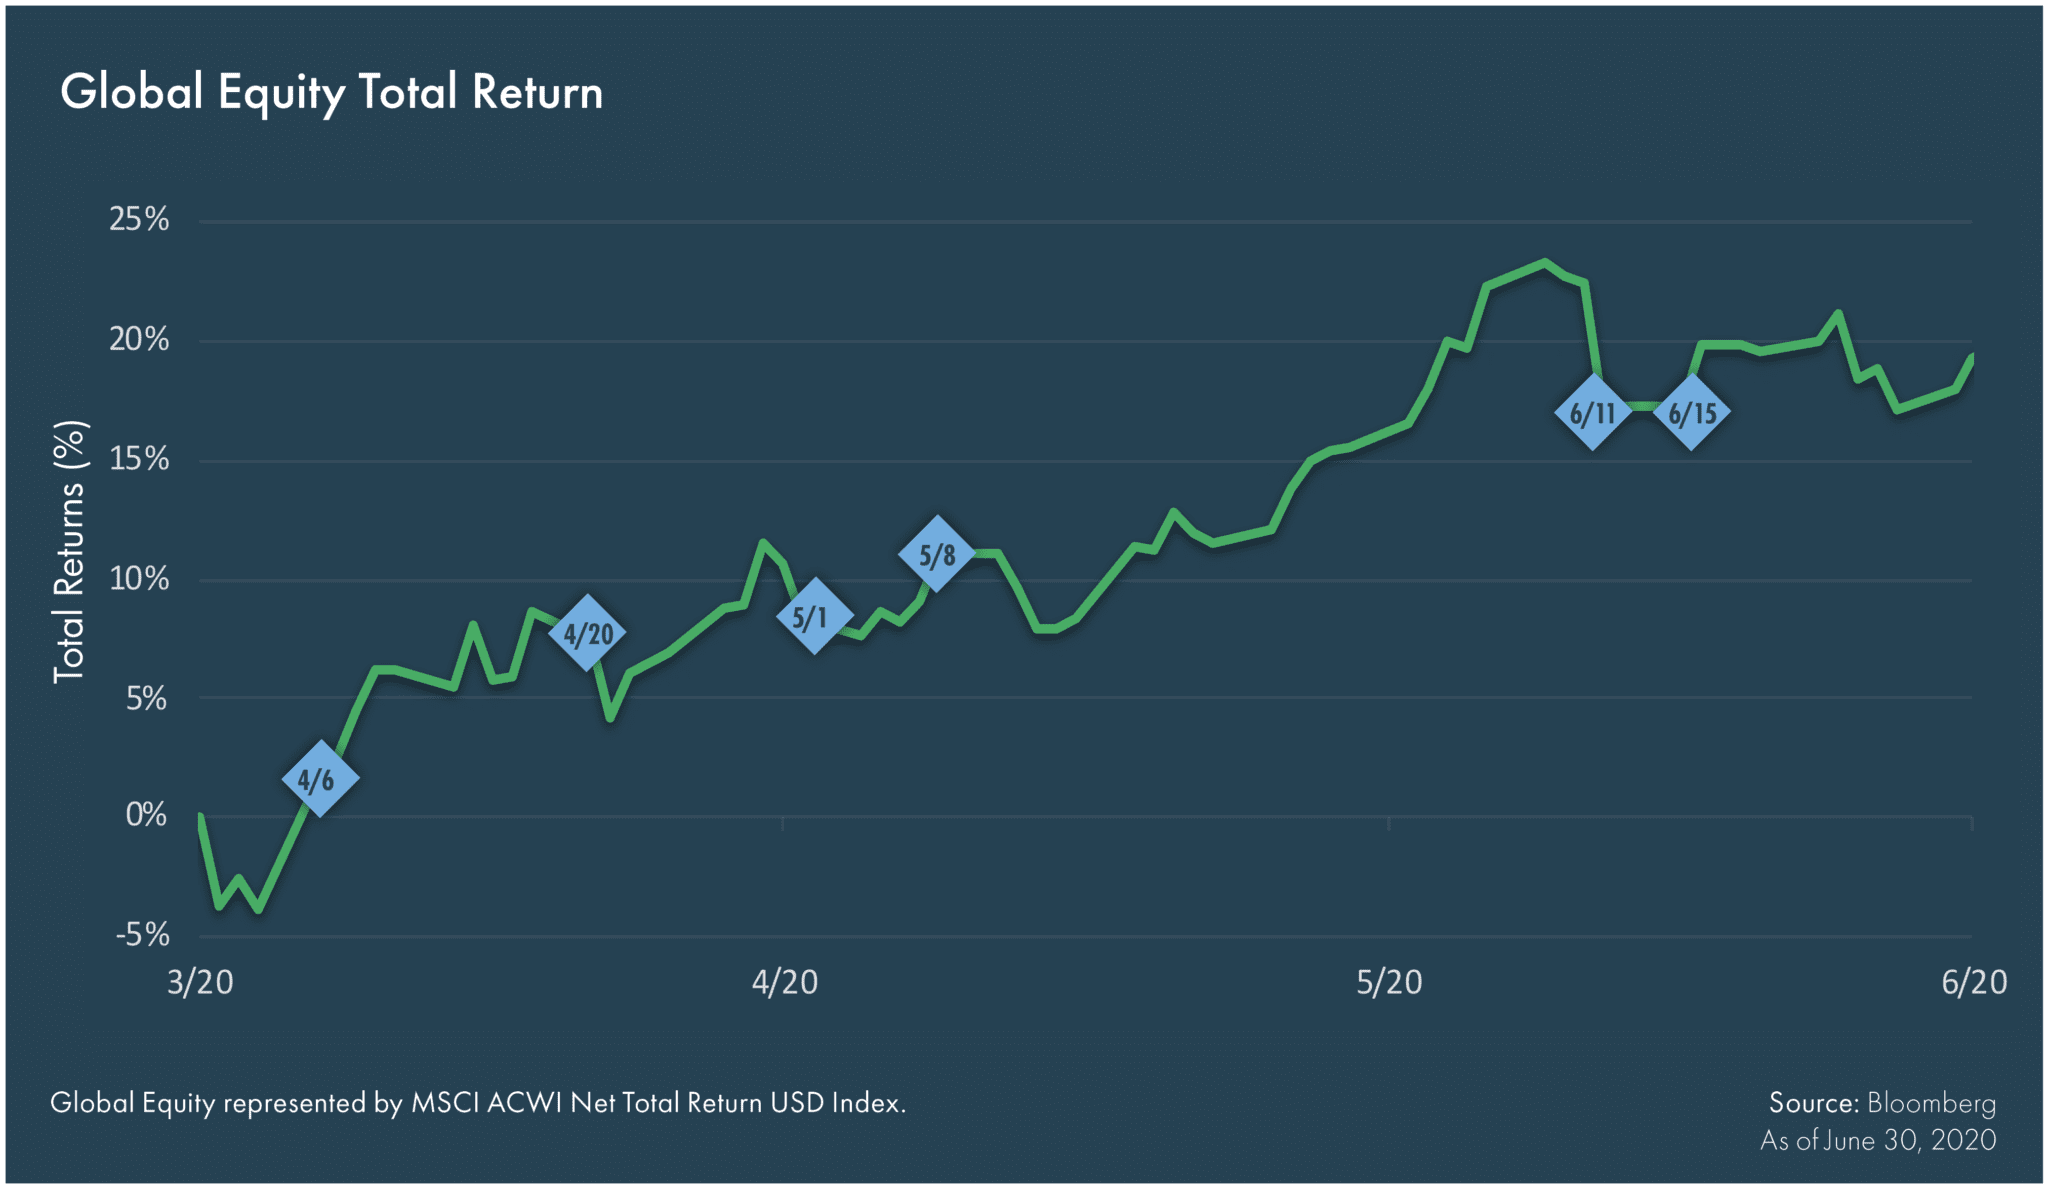
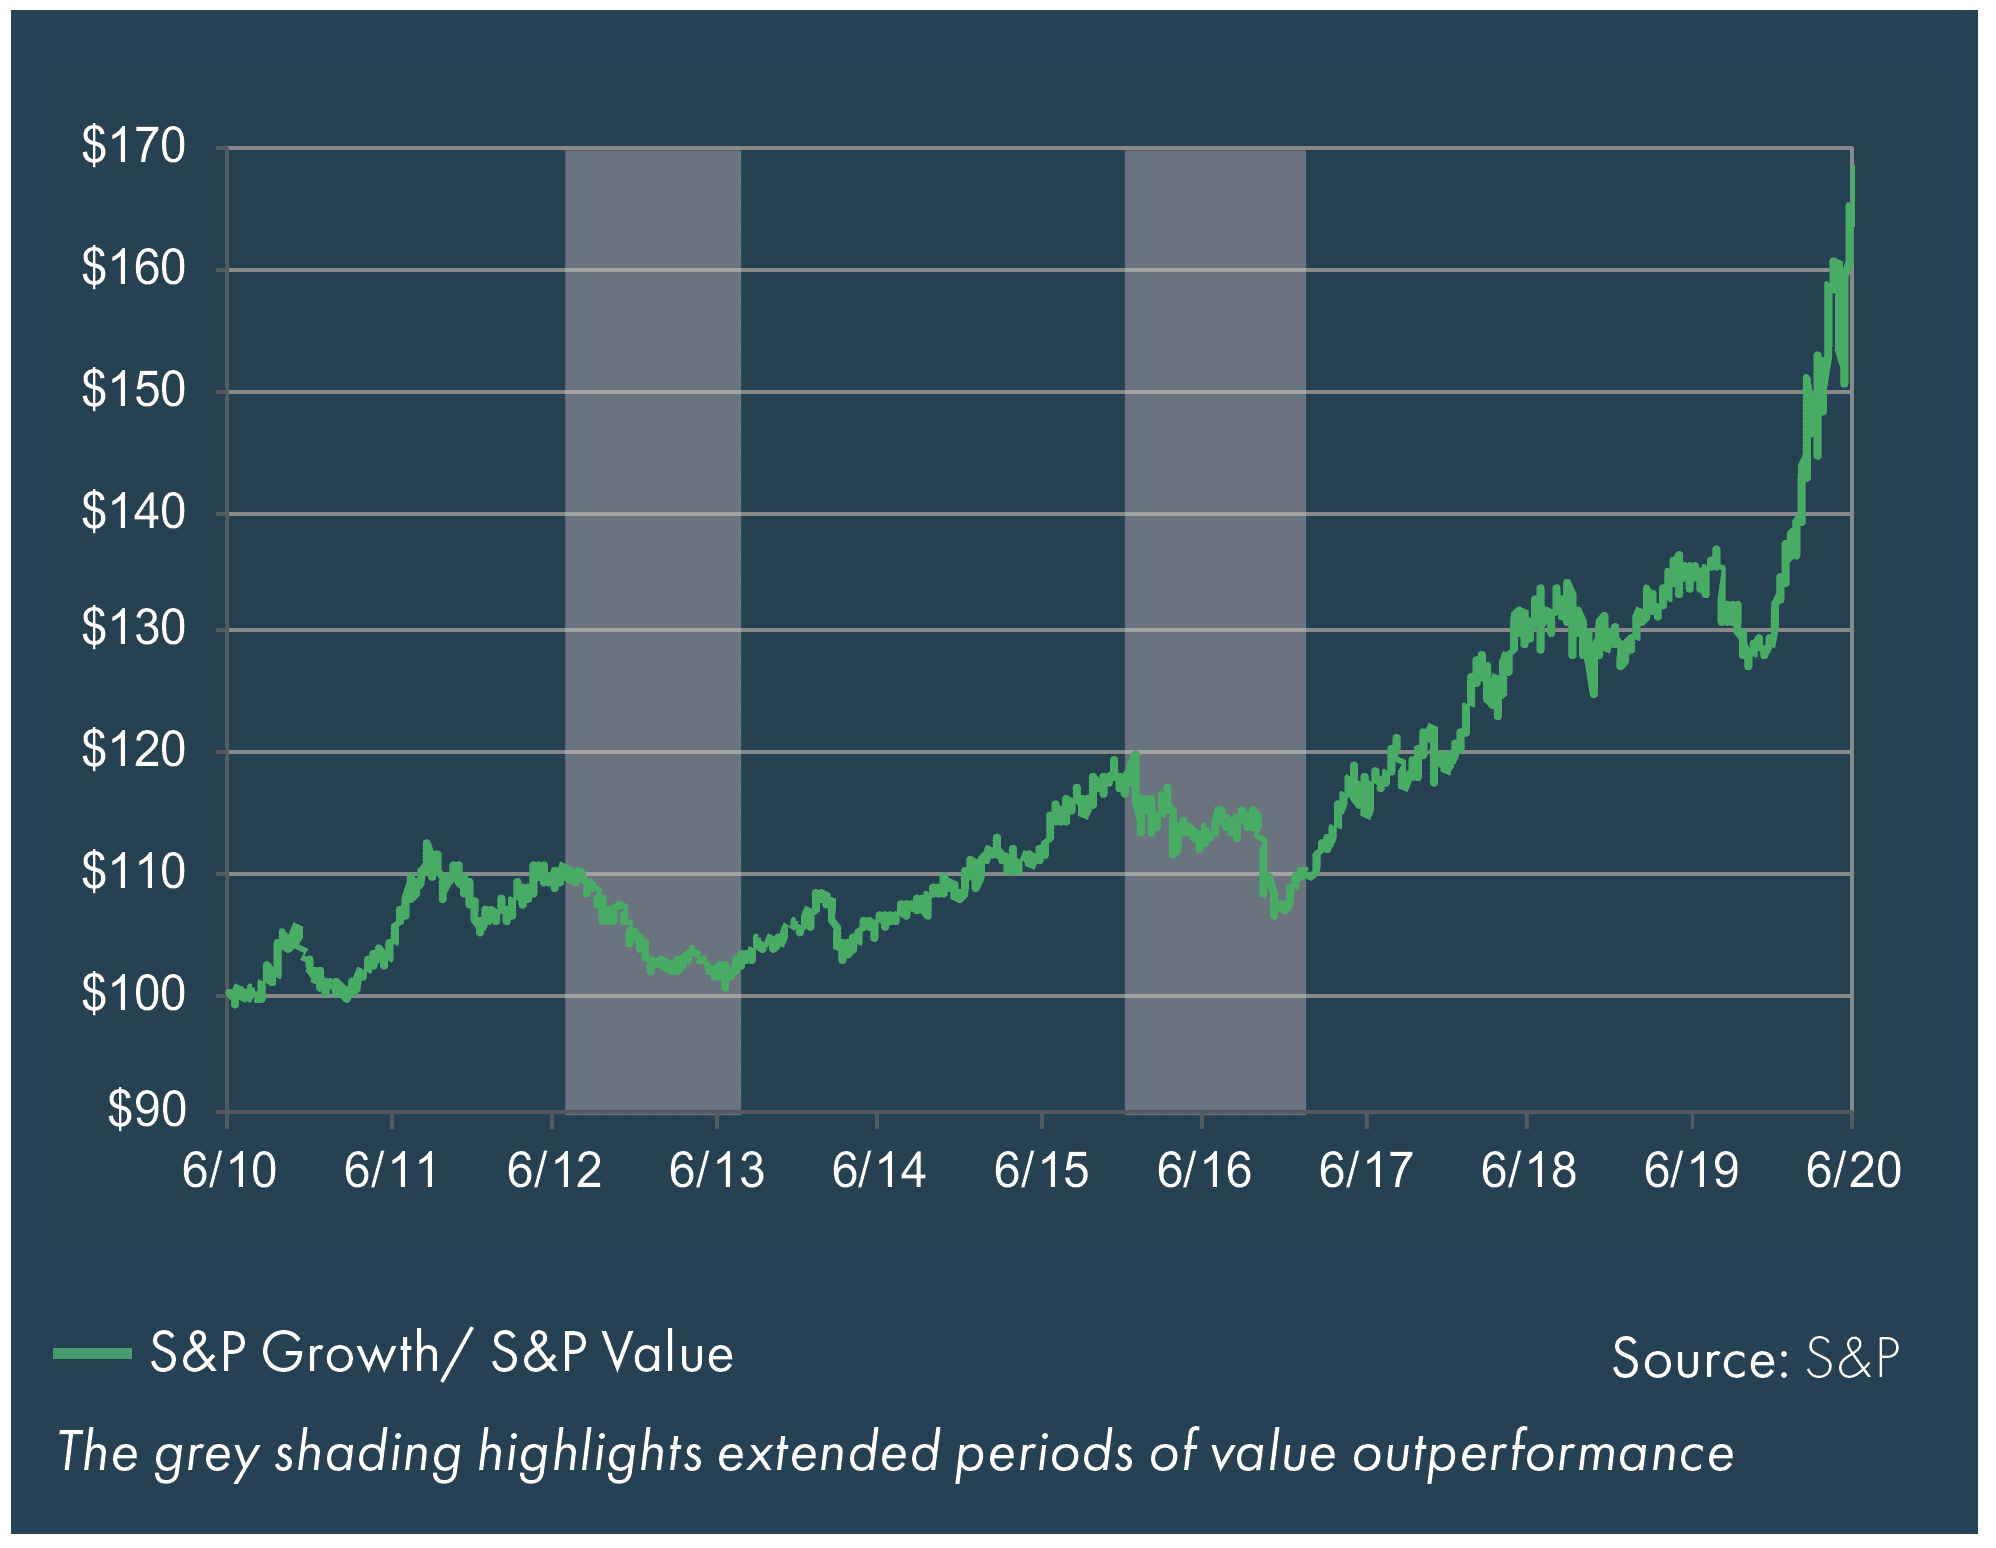
Equity — Growth vs. Value
The rally in growth stocks continued for much of the second quarter with the exception of a couple weeks in early June.
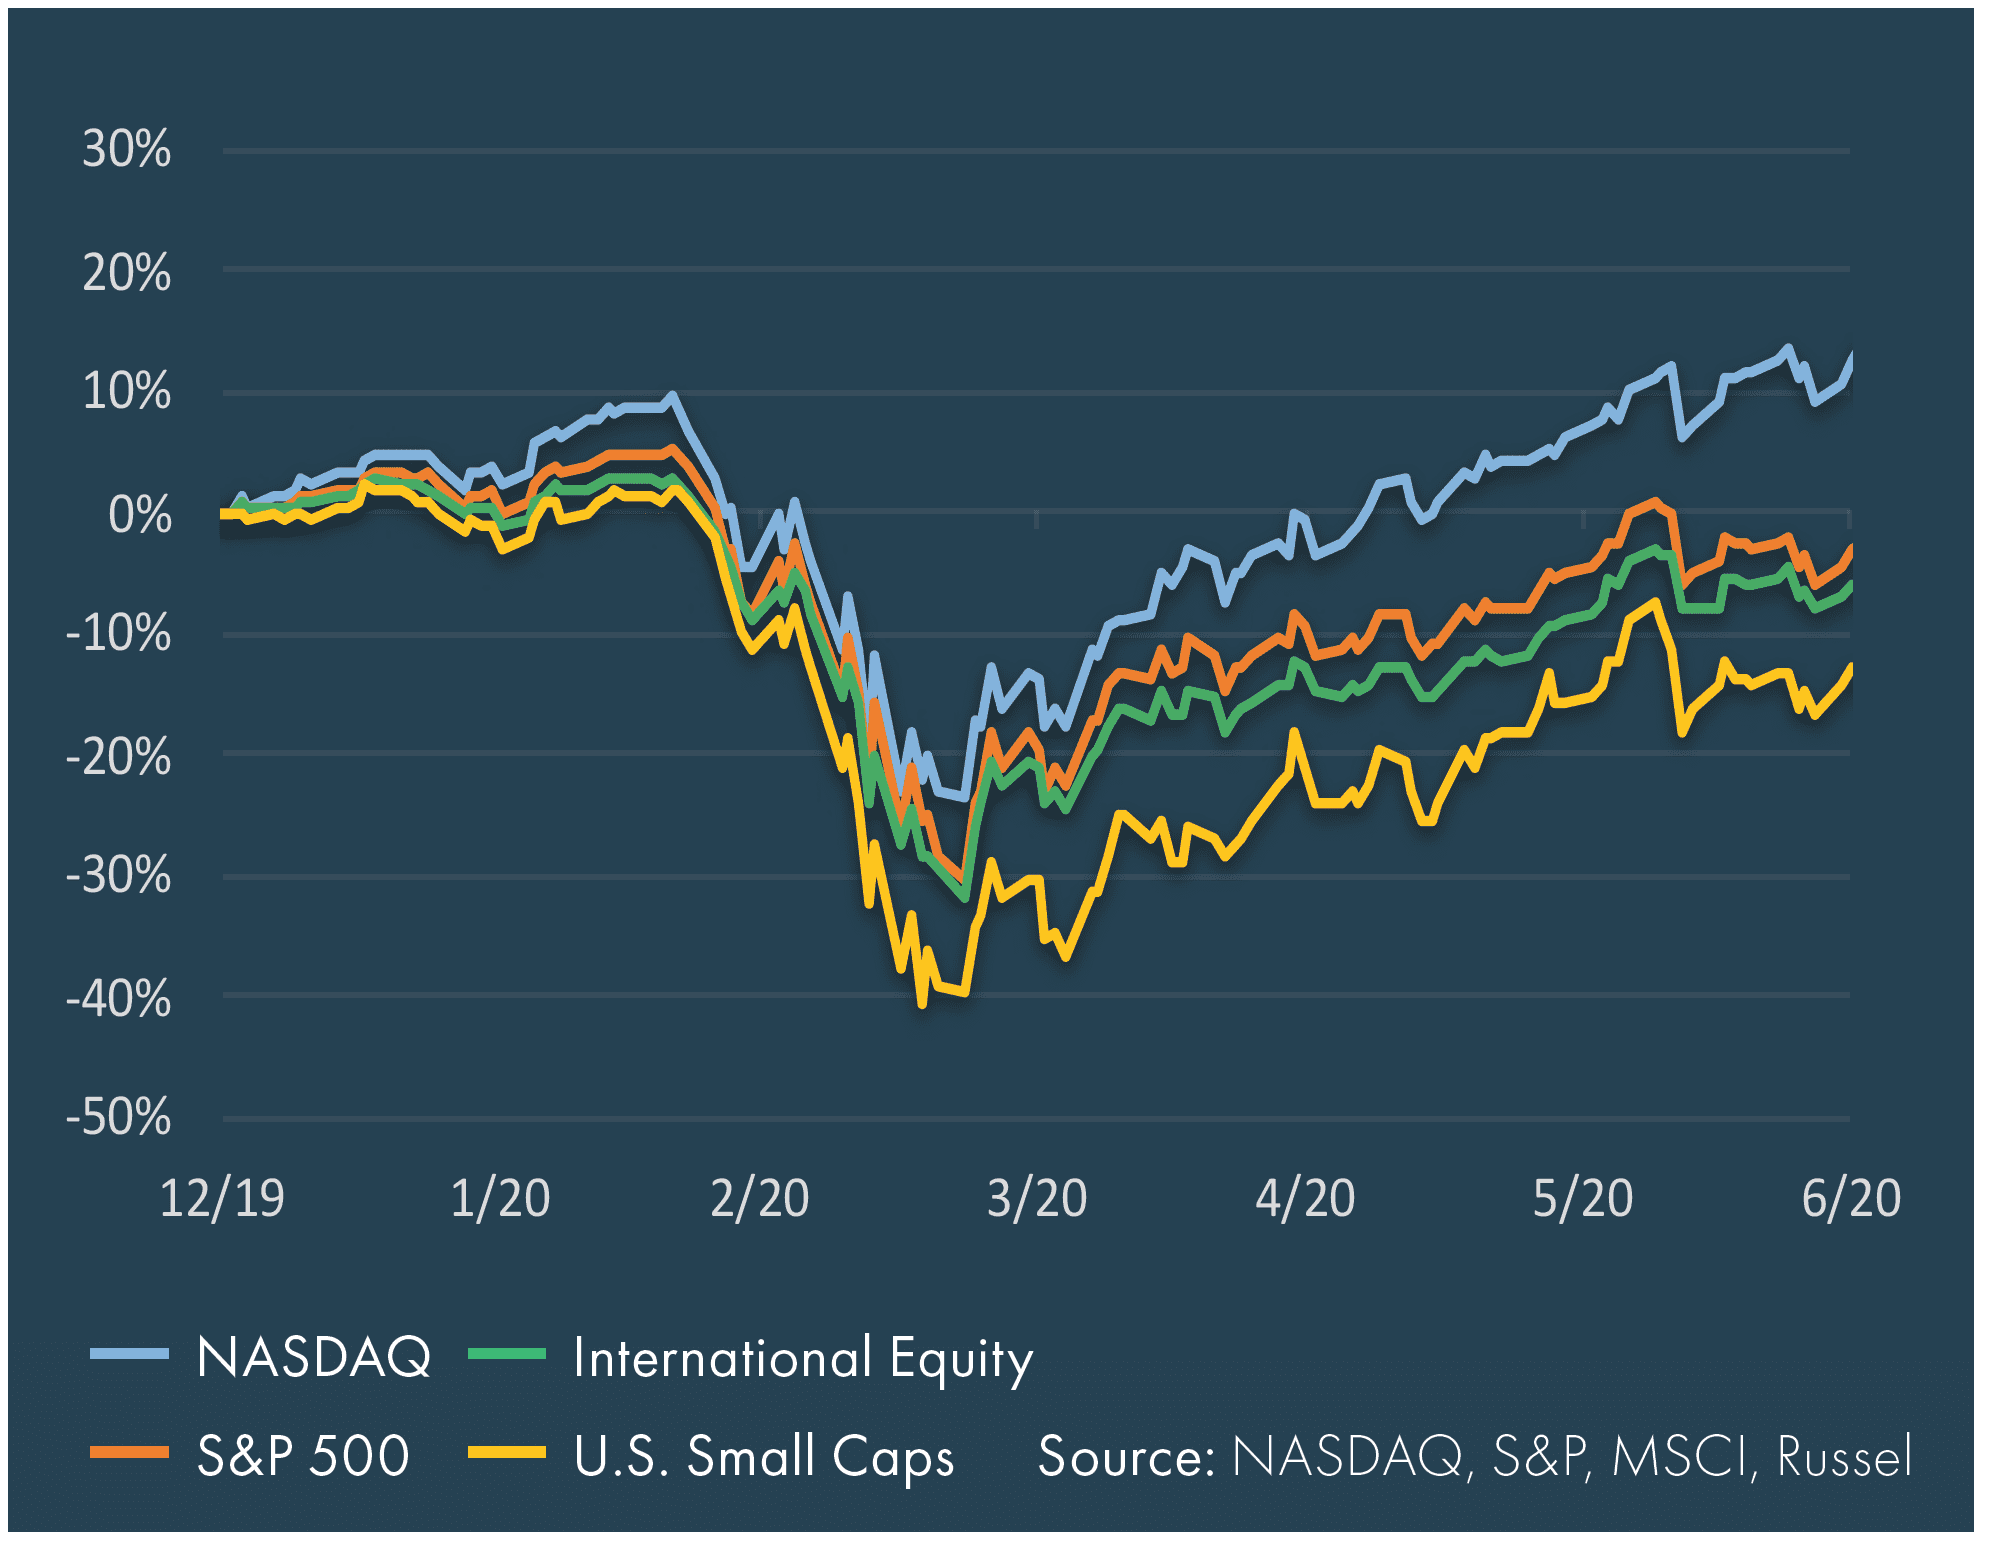
Equity Performance – Sector, Region, Market Cap
Technology-heavy NASDAQ was the clear outperformer, whereas U.S. small caps have struggled to recover from a 40% drop in late March.
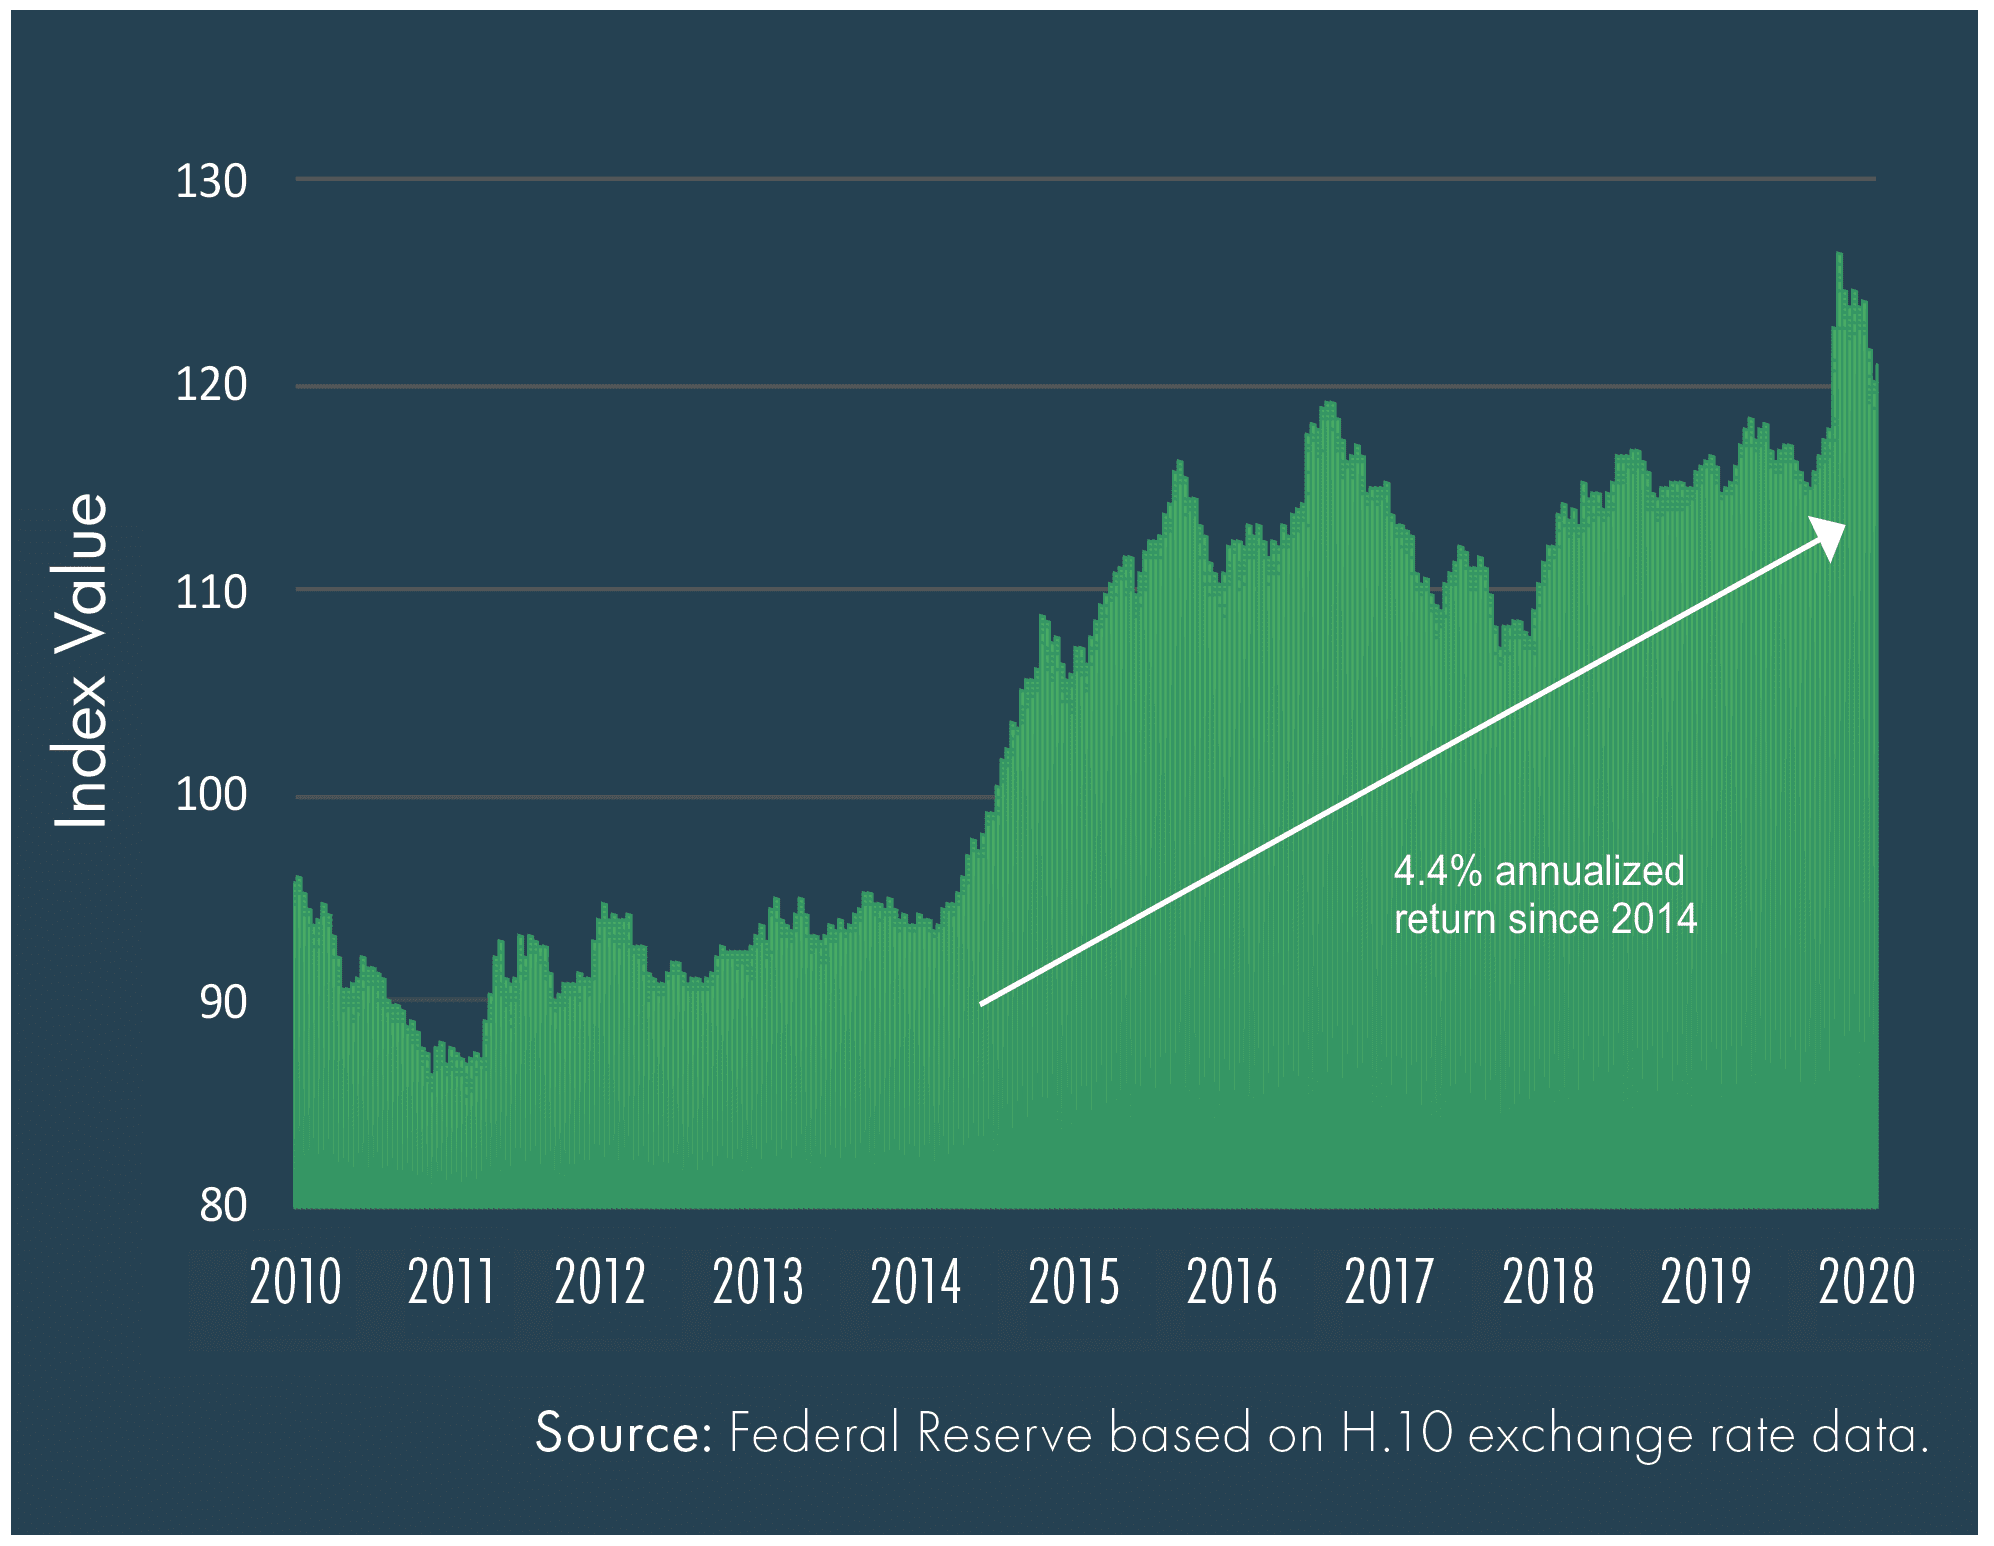
Trade Weighted U.S. Dollar
U.S. dollar weakness emerged amid increased monetary accommodation and the Fed’s willingness to do whatever it takes.
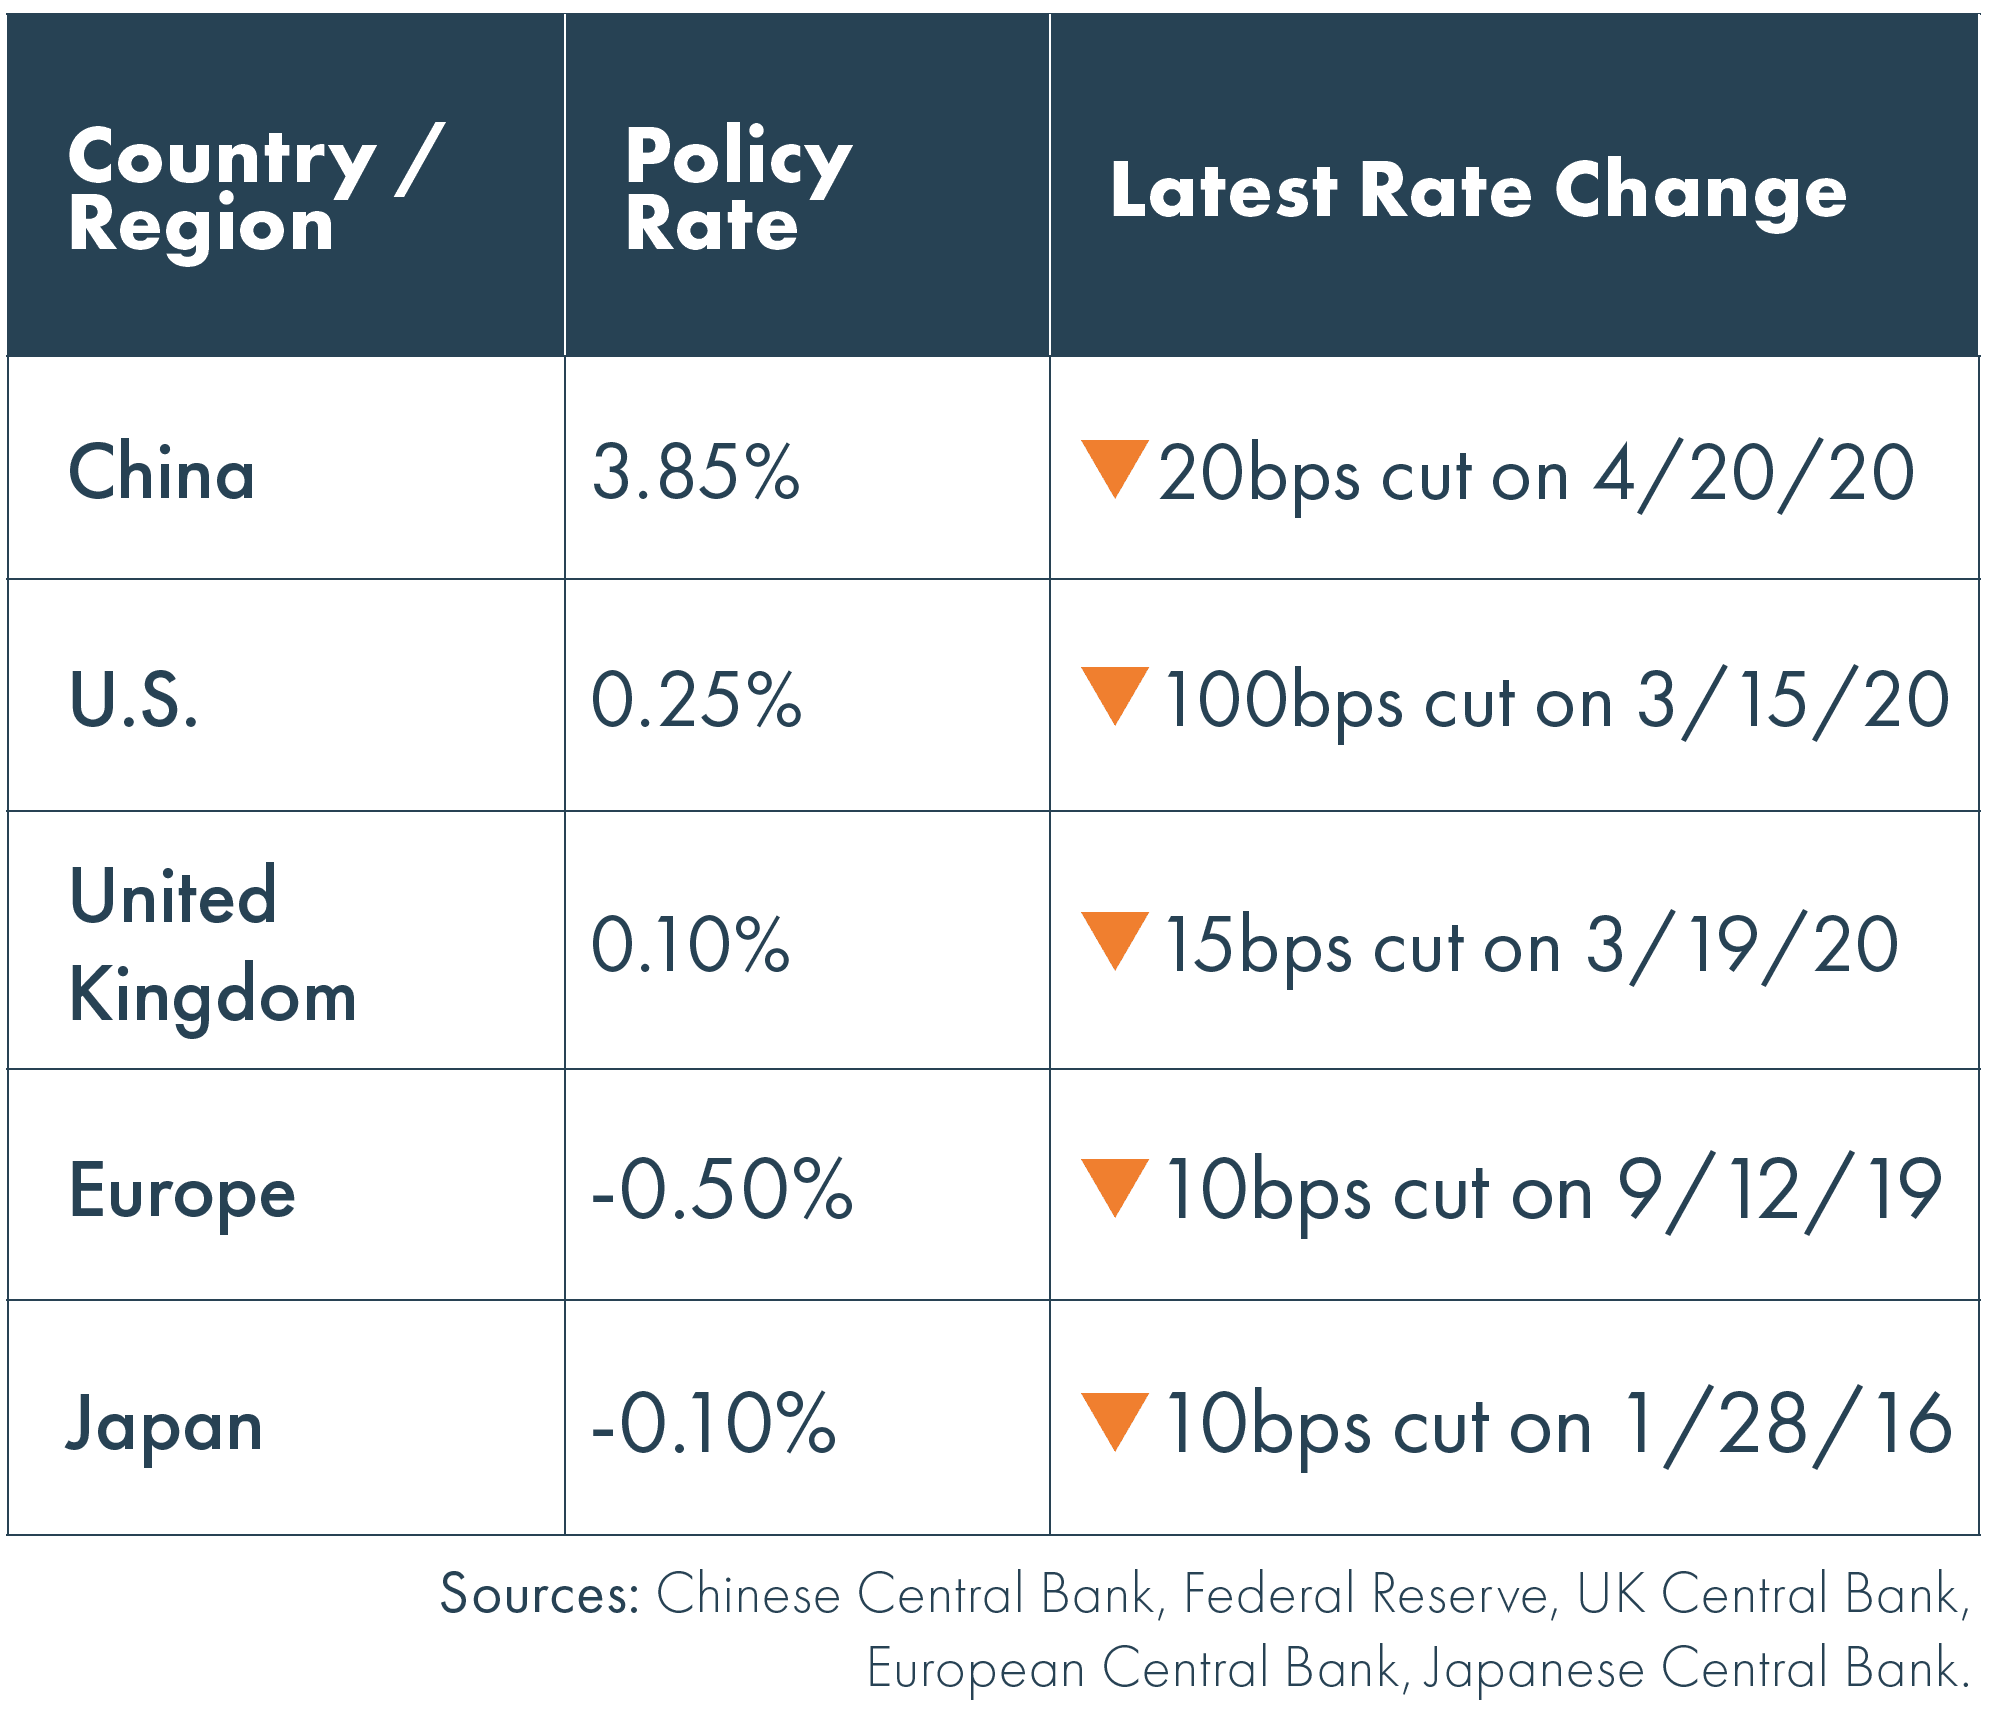
Monetary Policy Rates
Central bank policy rates remain low and have been cut even further toward the zero bound in the U.S. and U.K.
Fixed Income Market Update
Graphic Data Represented As of 6/30/2020
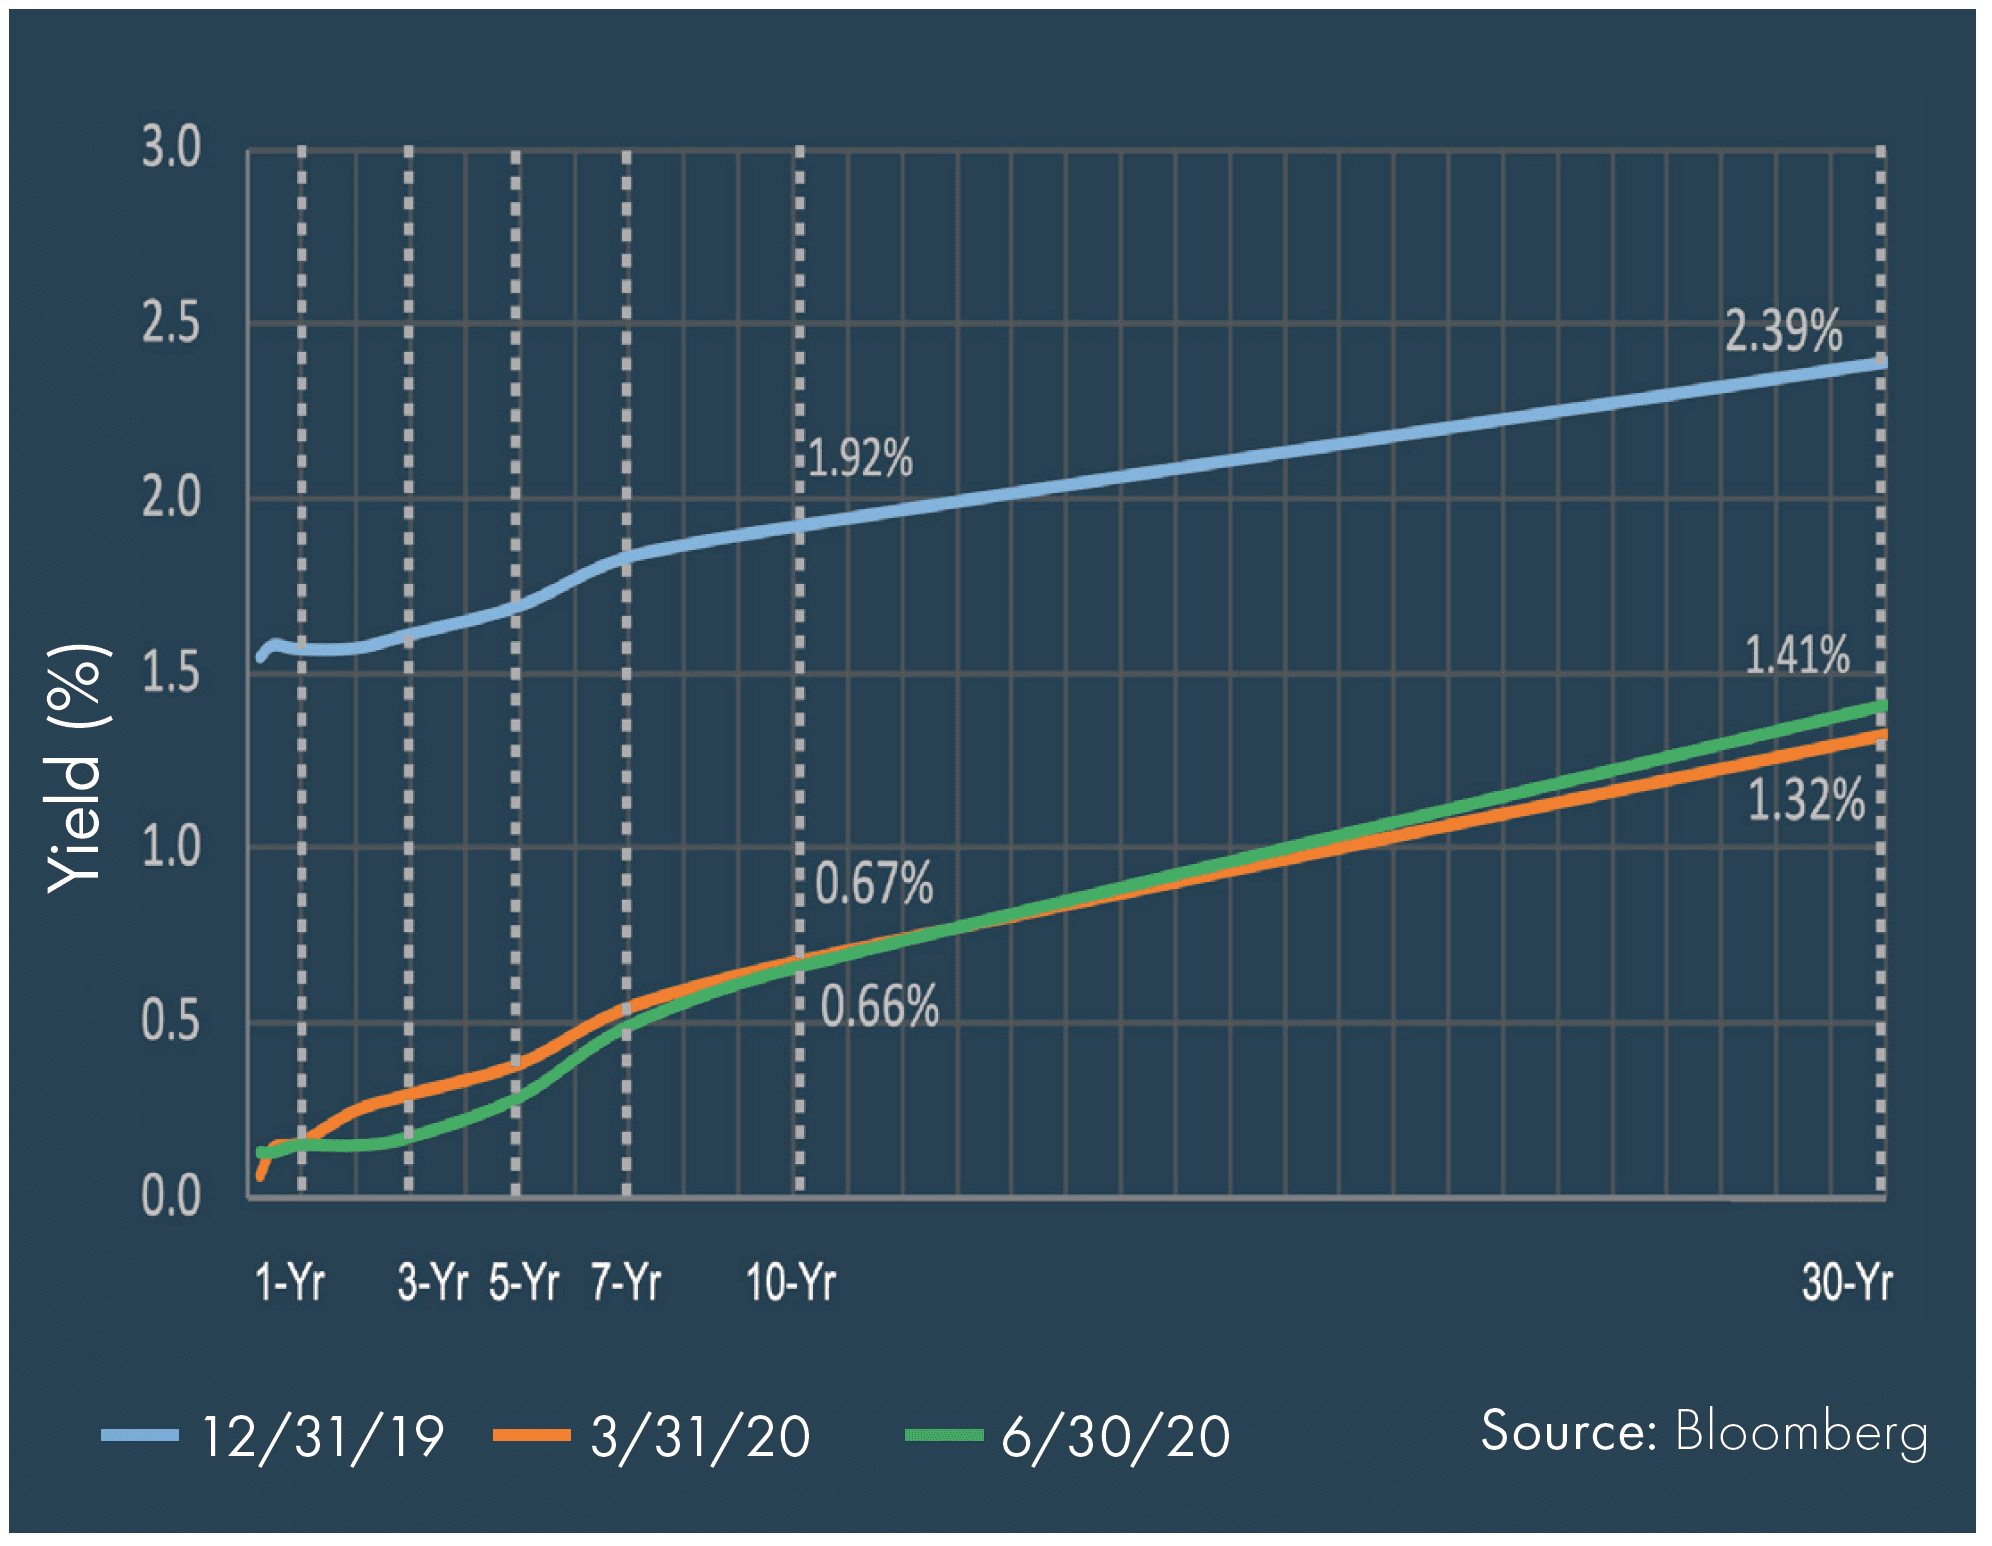
U.S. Treasury Curve
U.S. Treasury yields traded relatively flat with the Fed keeping the front-end anchored and economic uncertainty weighing on the back-end.
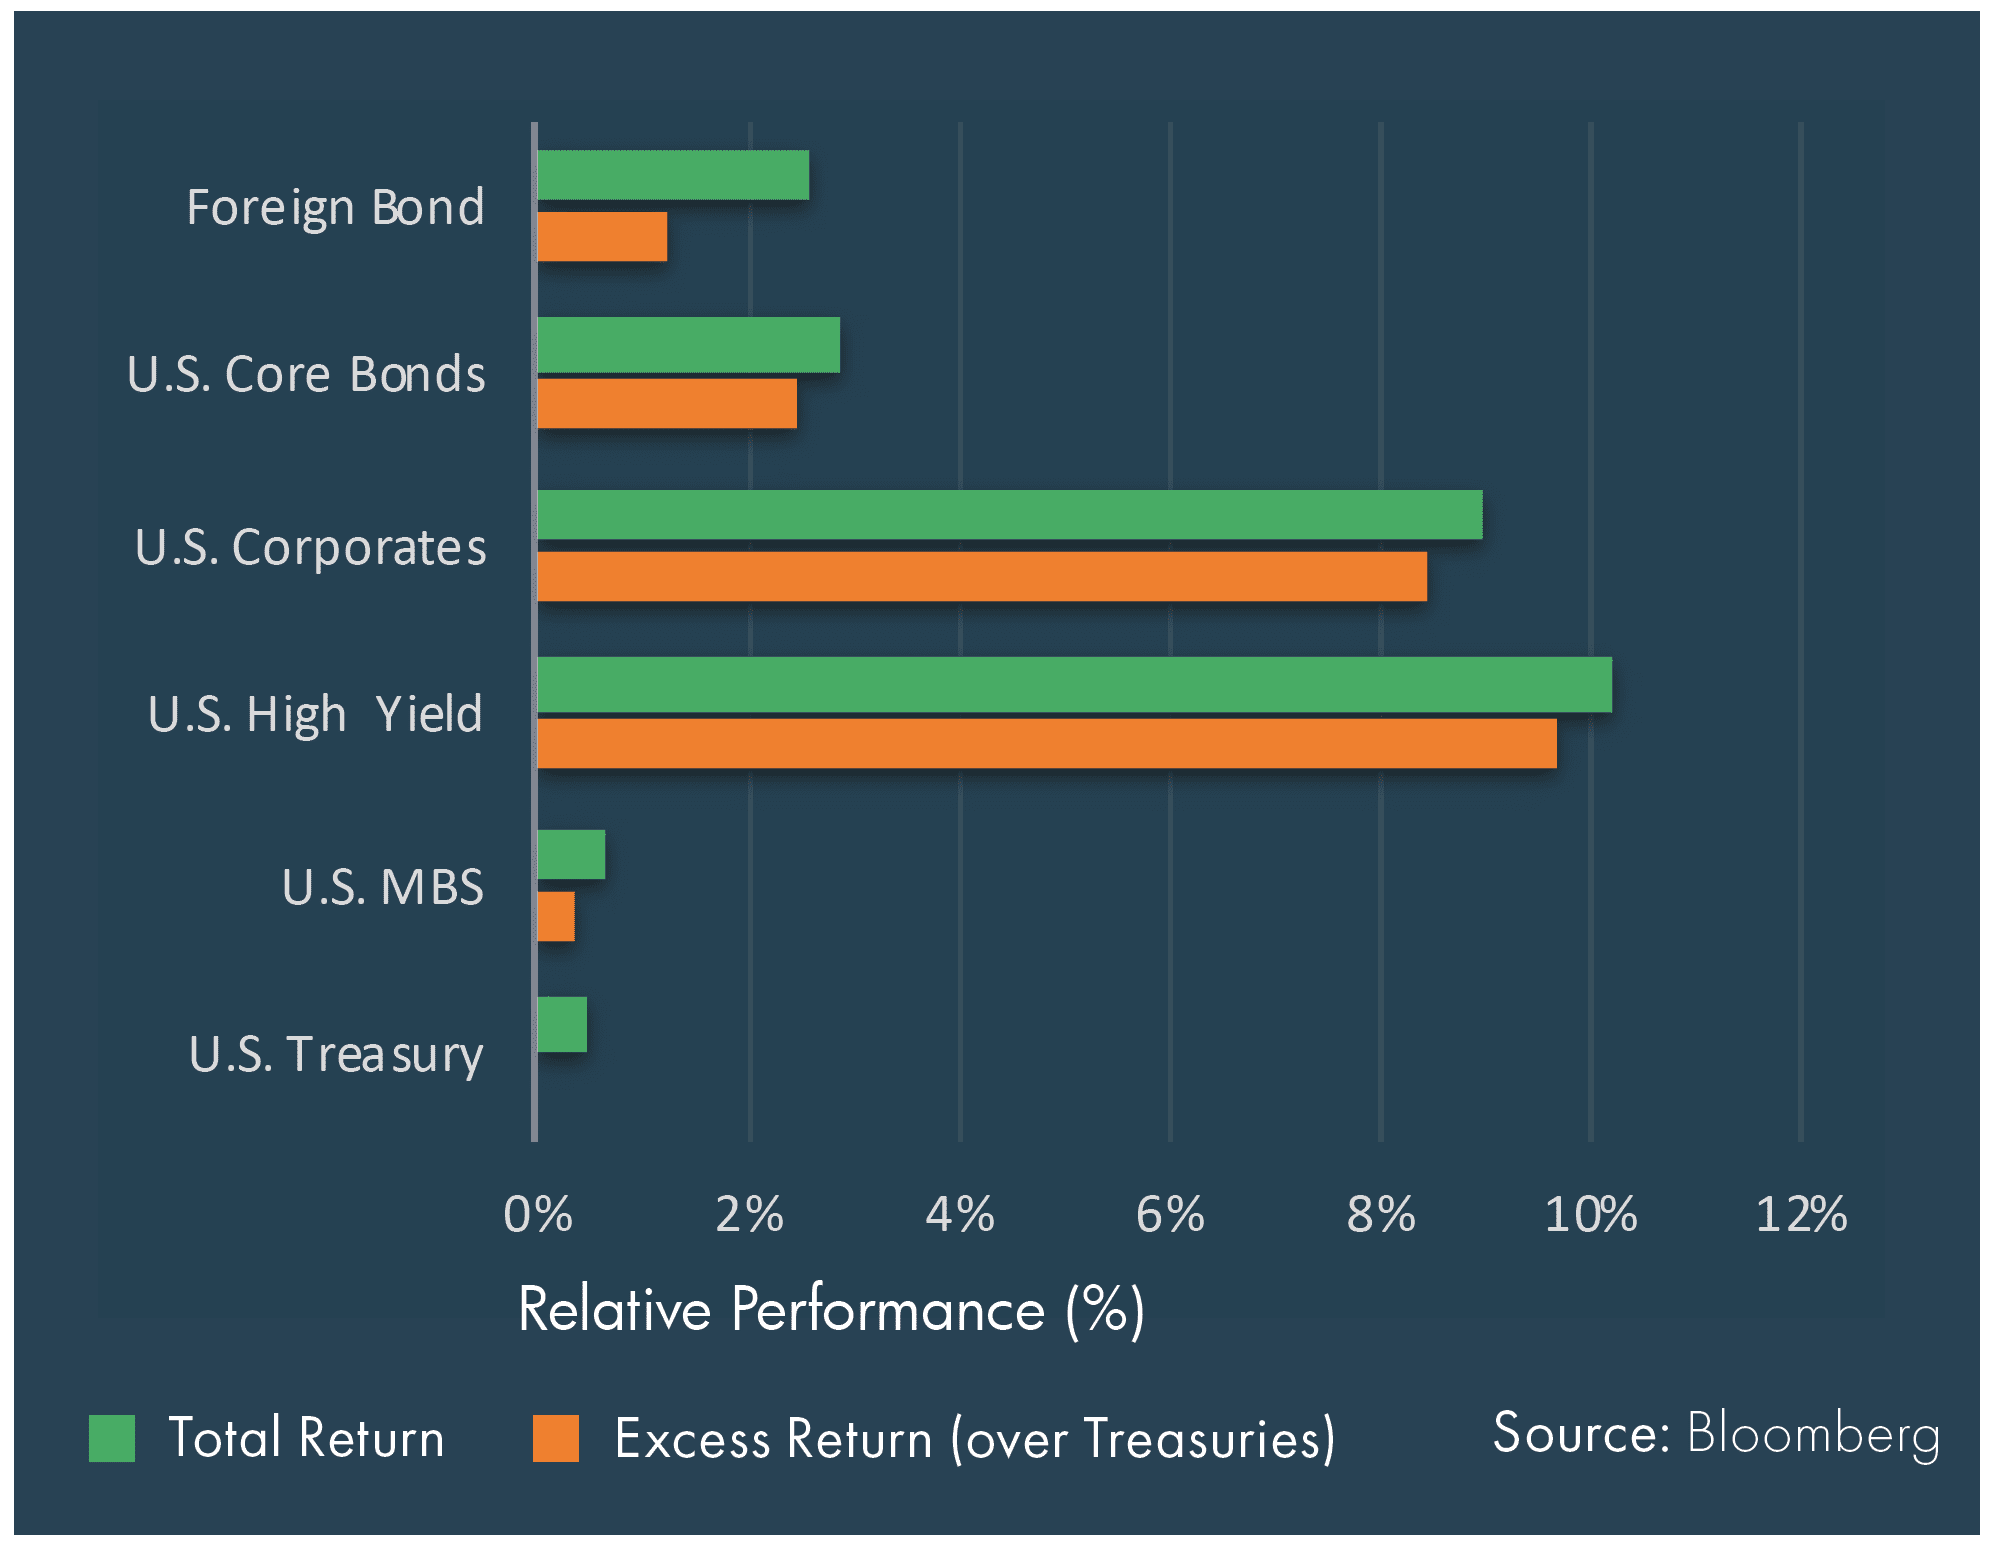
Index Performance Attribution (2Q20)
Positive performance was likely driven by spread compression – notably different from the first quarter when risk-free rates fell and spreads widened.
Credit Market Spreads – Trailing 5 Years
The late-March spread rally carried over into the second quarter with investment grade and high-yield spreads tightening 122bps and 254bps, respectively. High-yield spreads remain over 140bps above the 10-year average, perhaps a sign that investors remain cautious about potential defaults.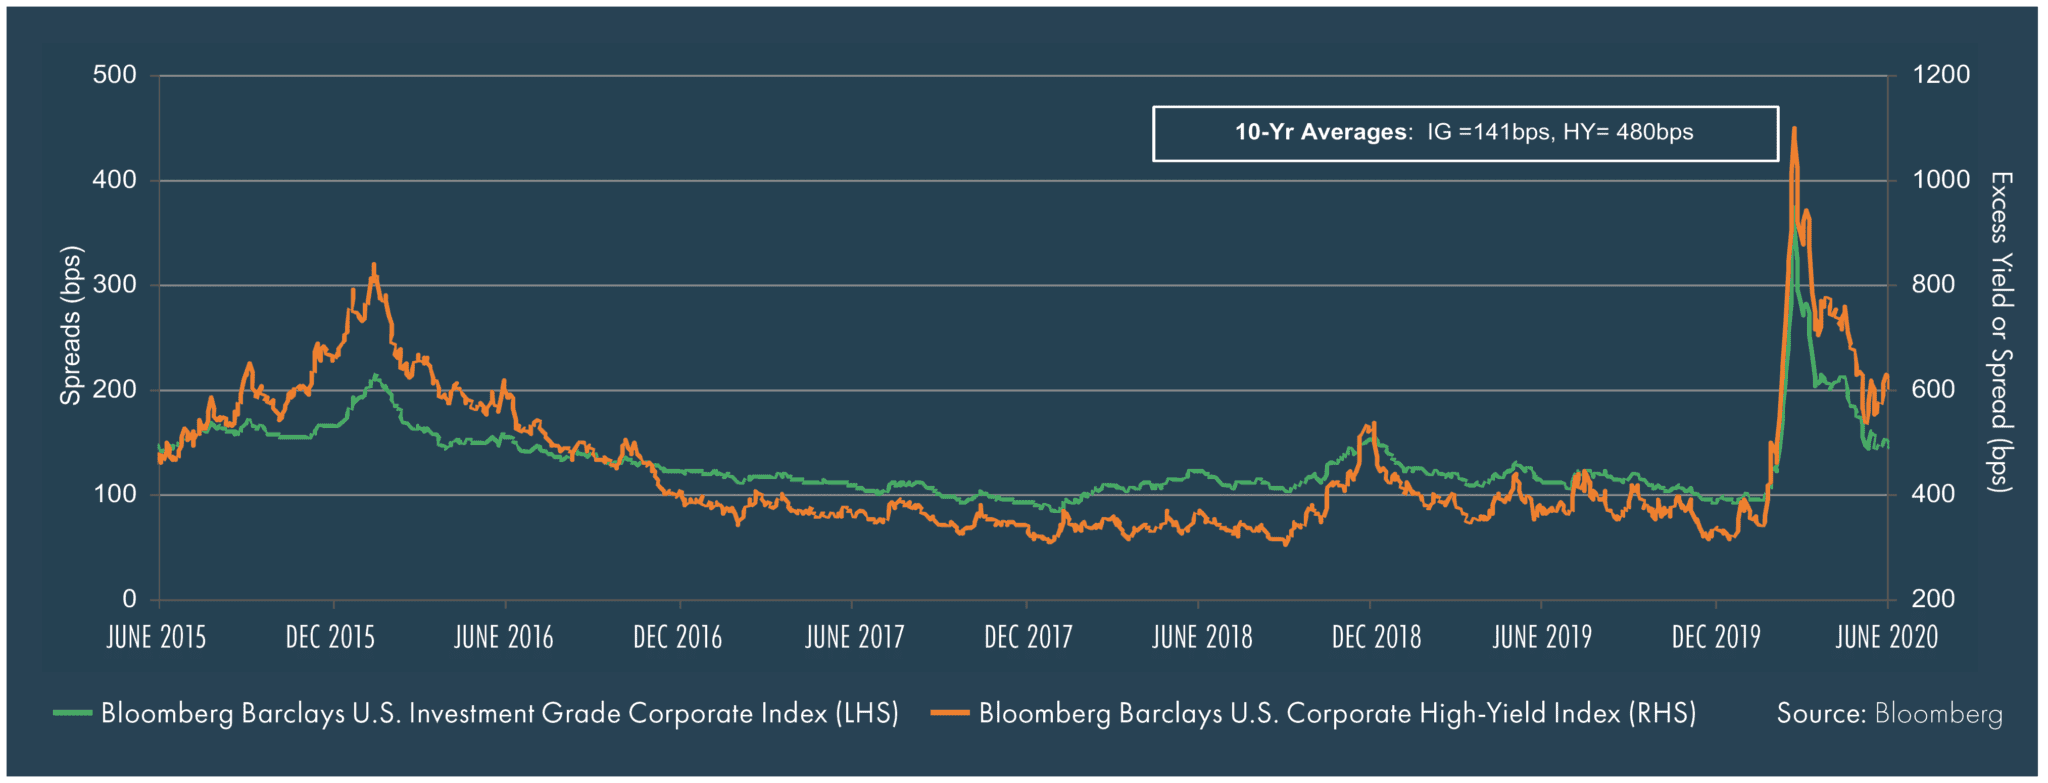
Equity Market Update
Graphic Data Represented As of 6/30/2020
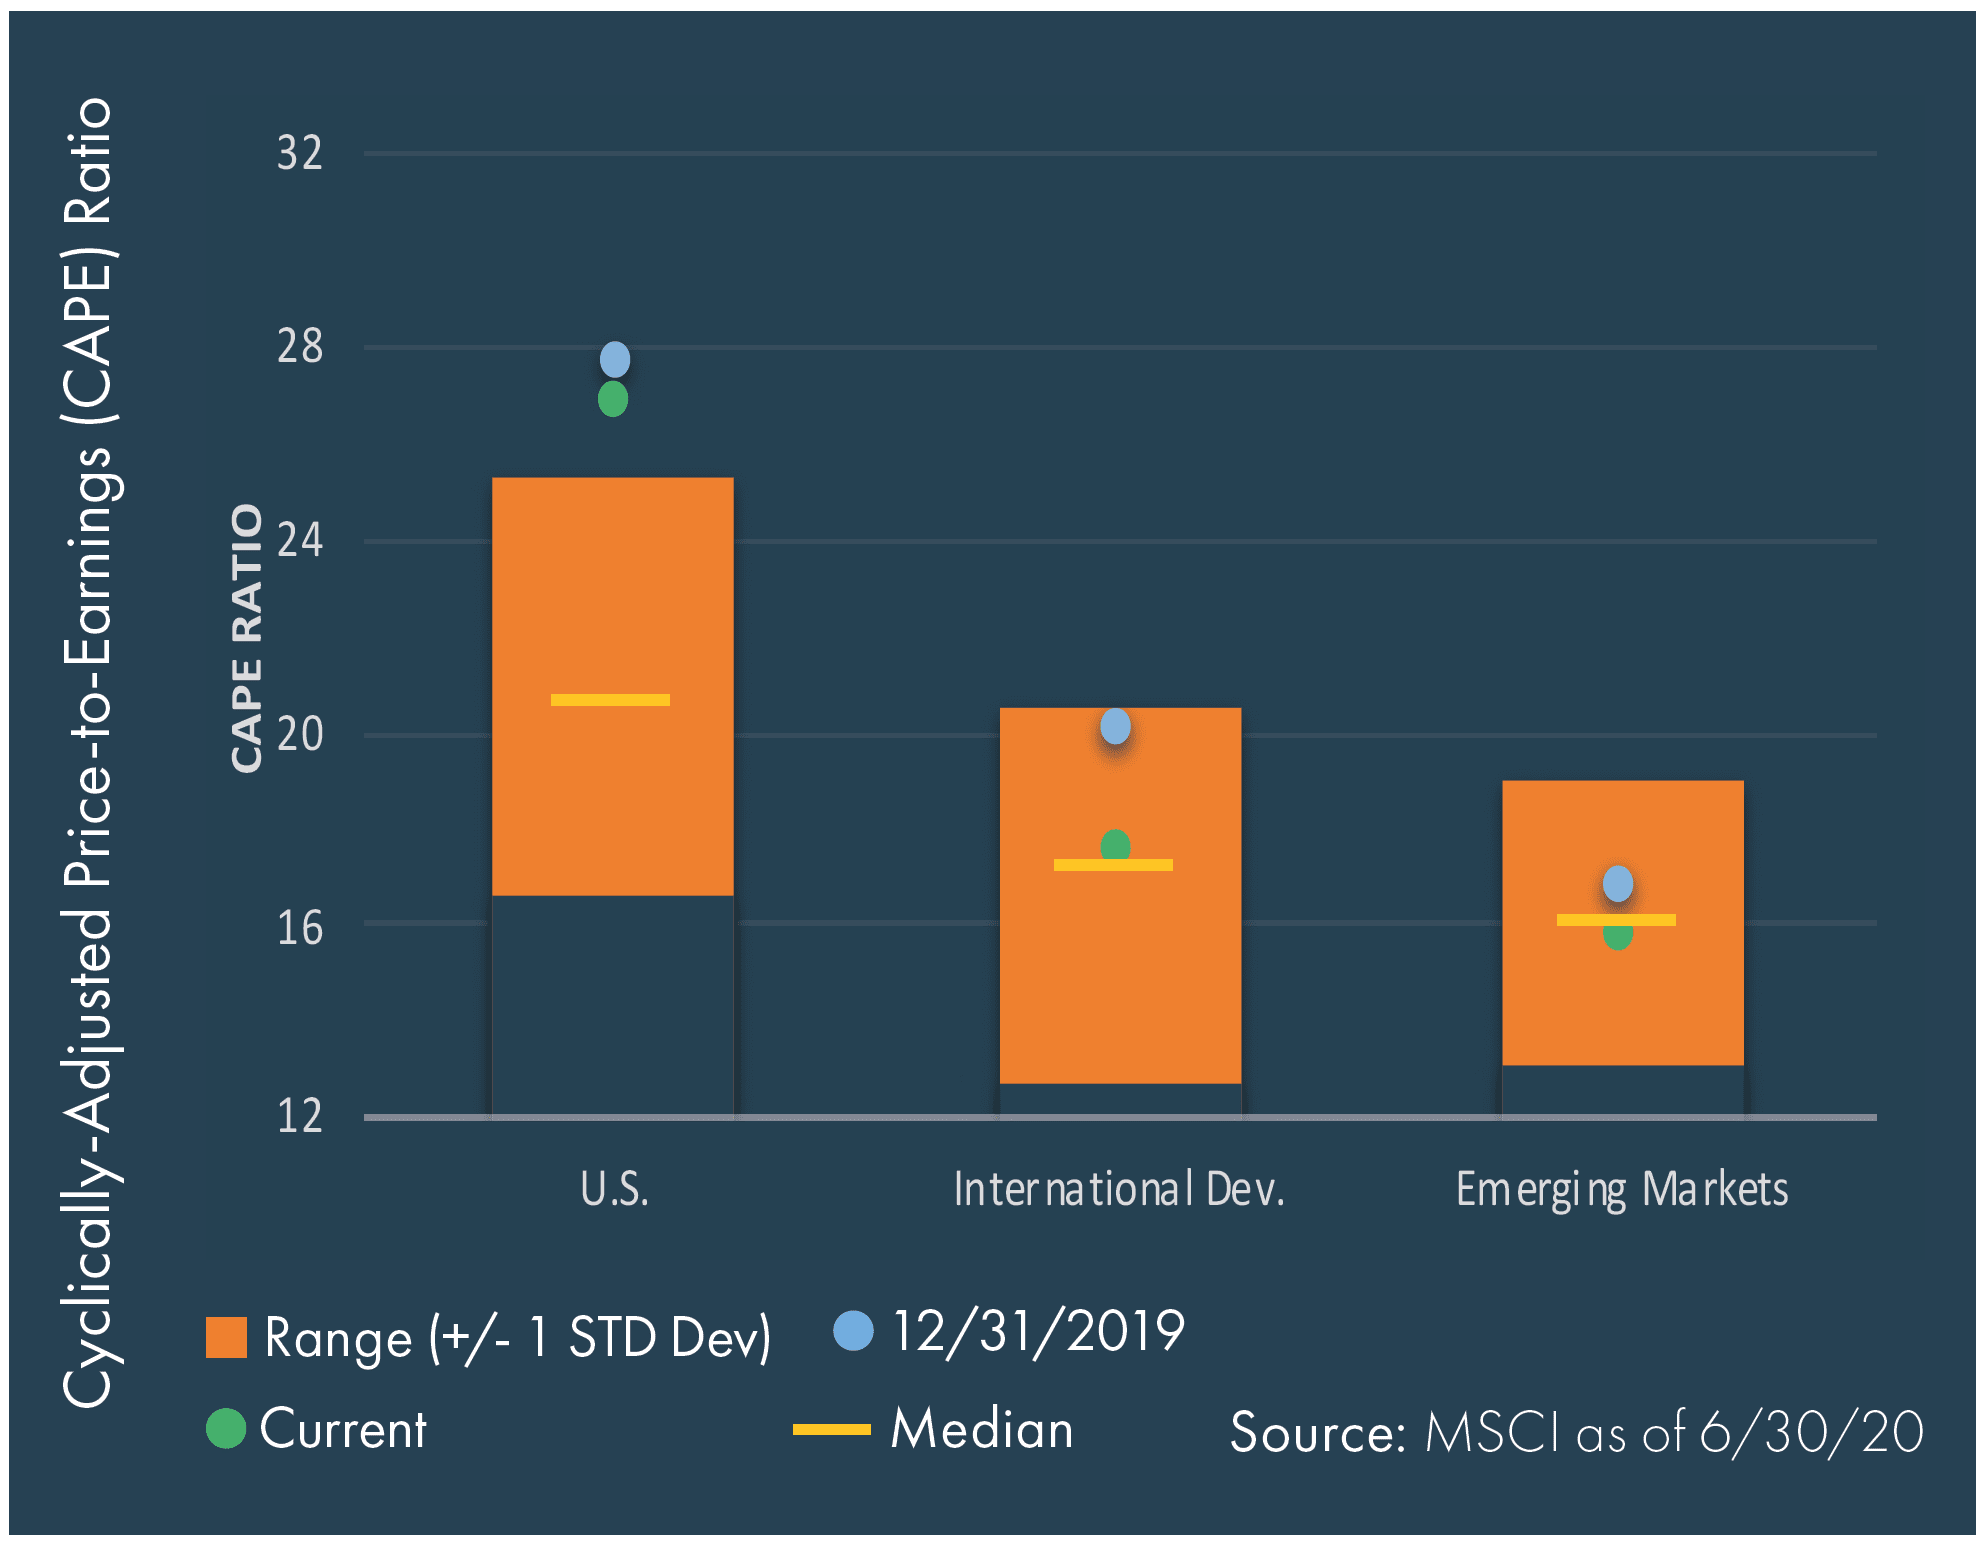
Equity Valuations (Trailing 15 Years)
The second quarter equity rally pushed up valuations globally, bringing them very close to pre-COVID 2019 year-end levels.
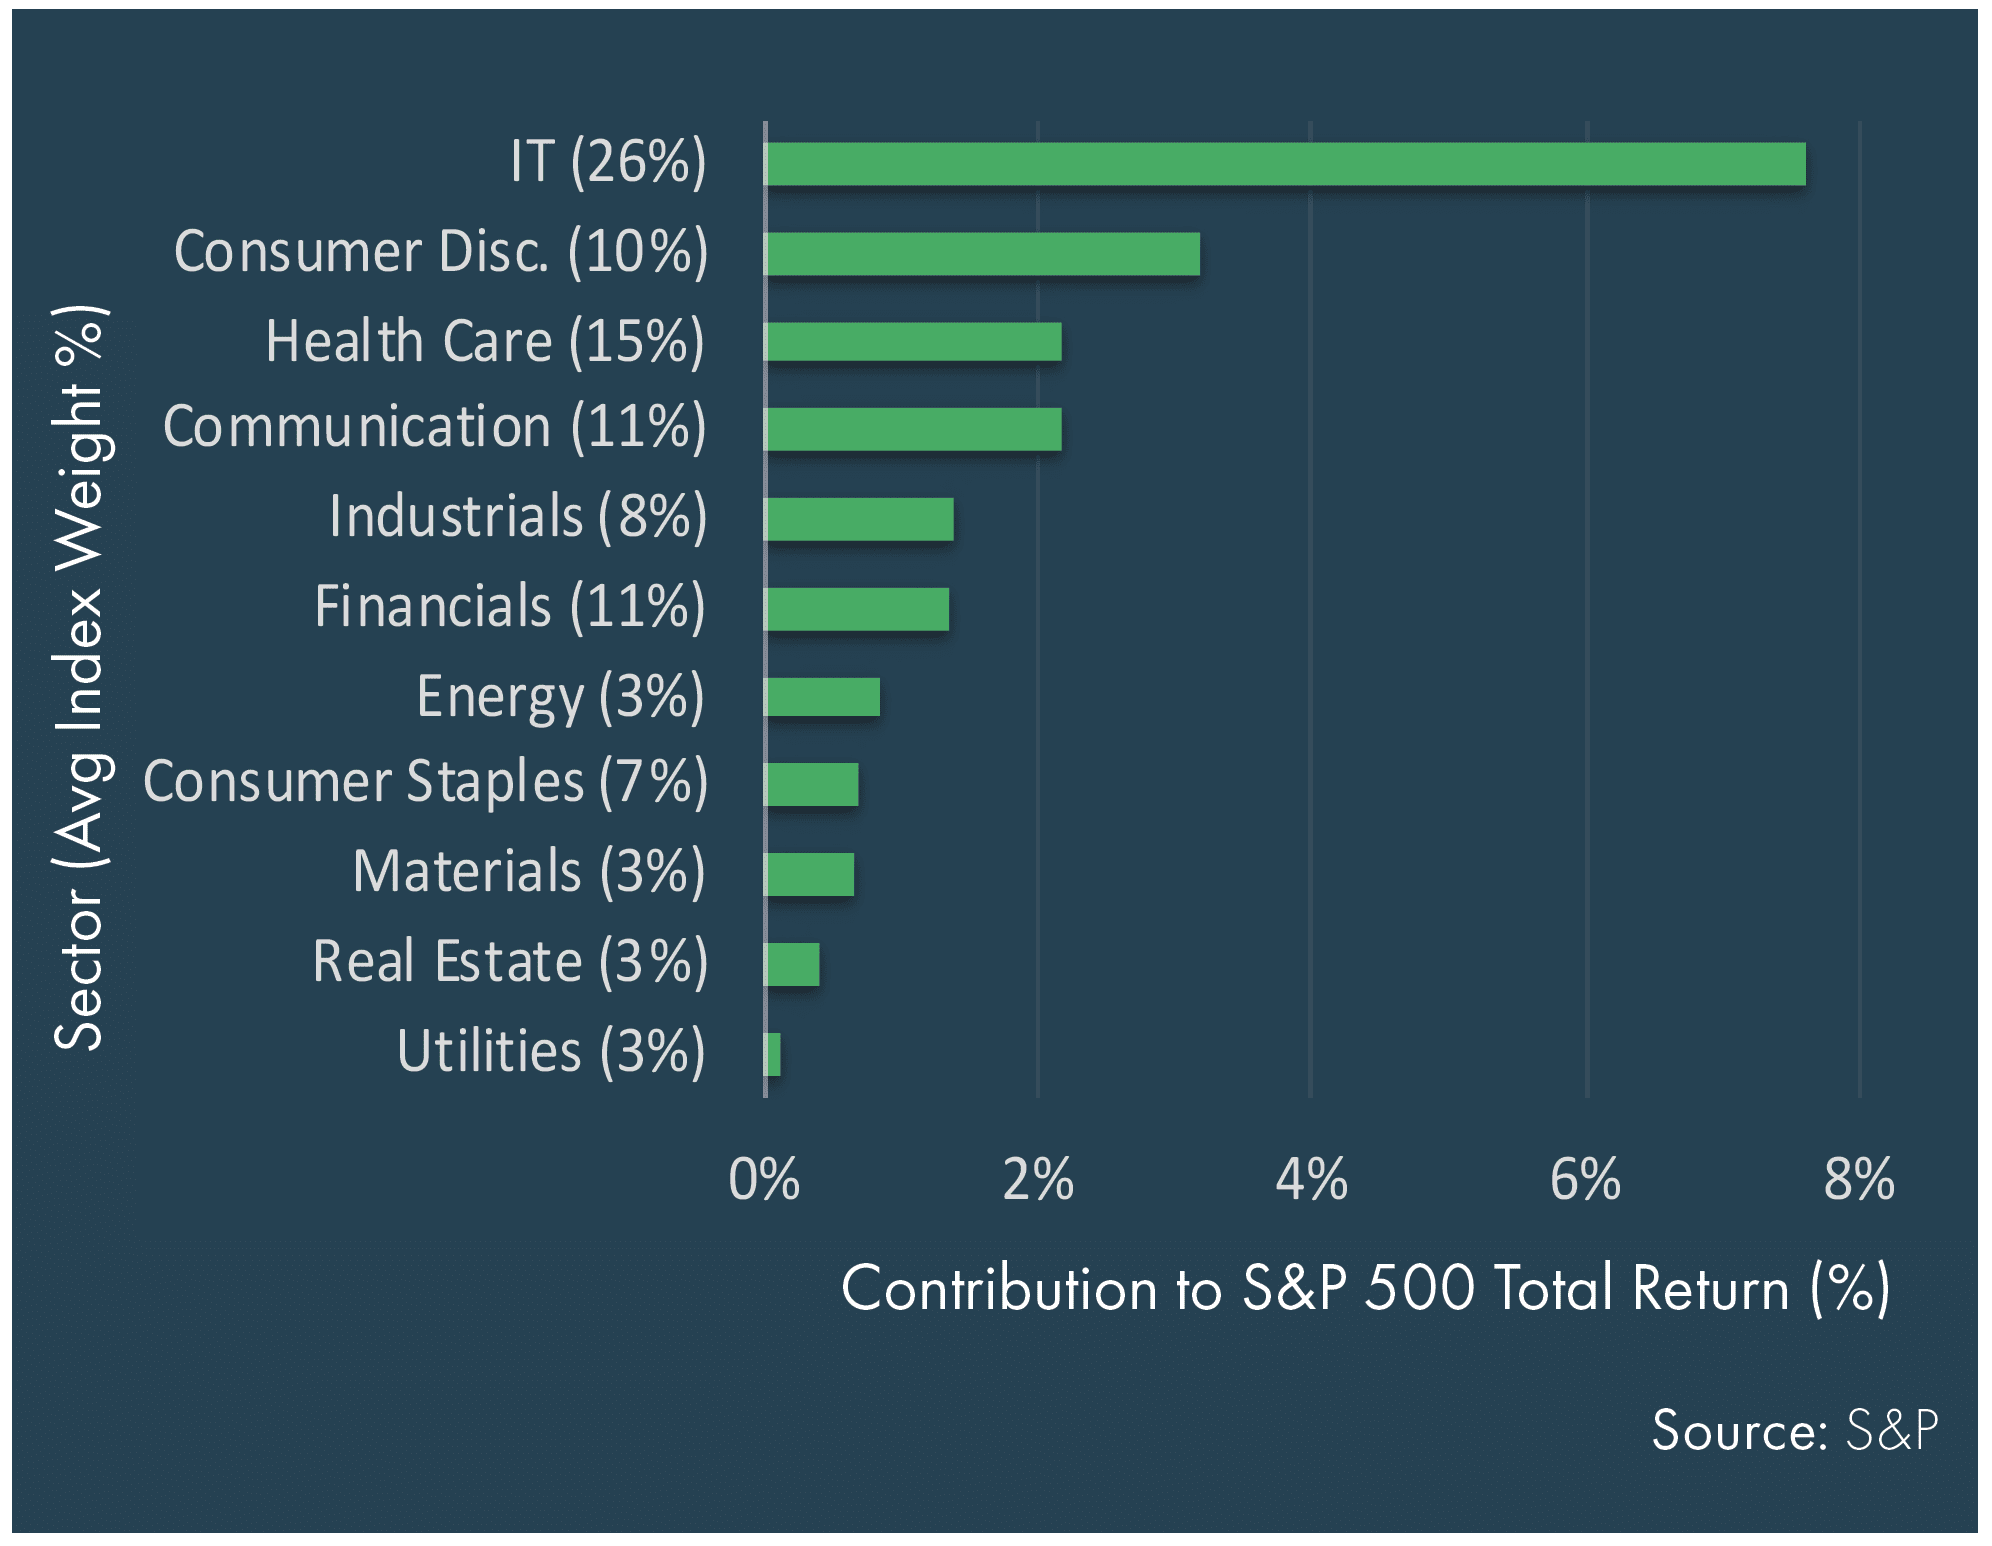
U.S. Equities – Contribution to Return by Sector (2Q20)
Technology contributed nearly half of the quarterly total return, driven by very strong performance and a meaningful index weight of 26%.
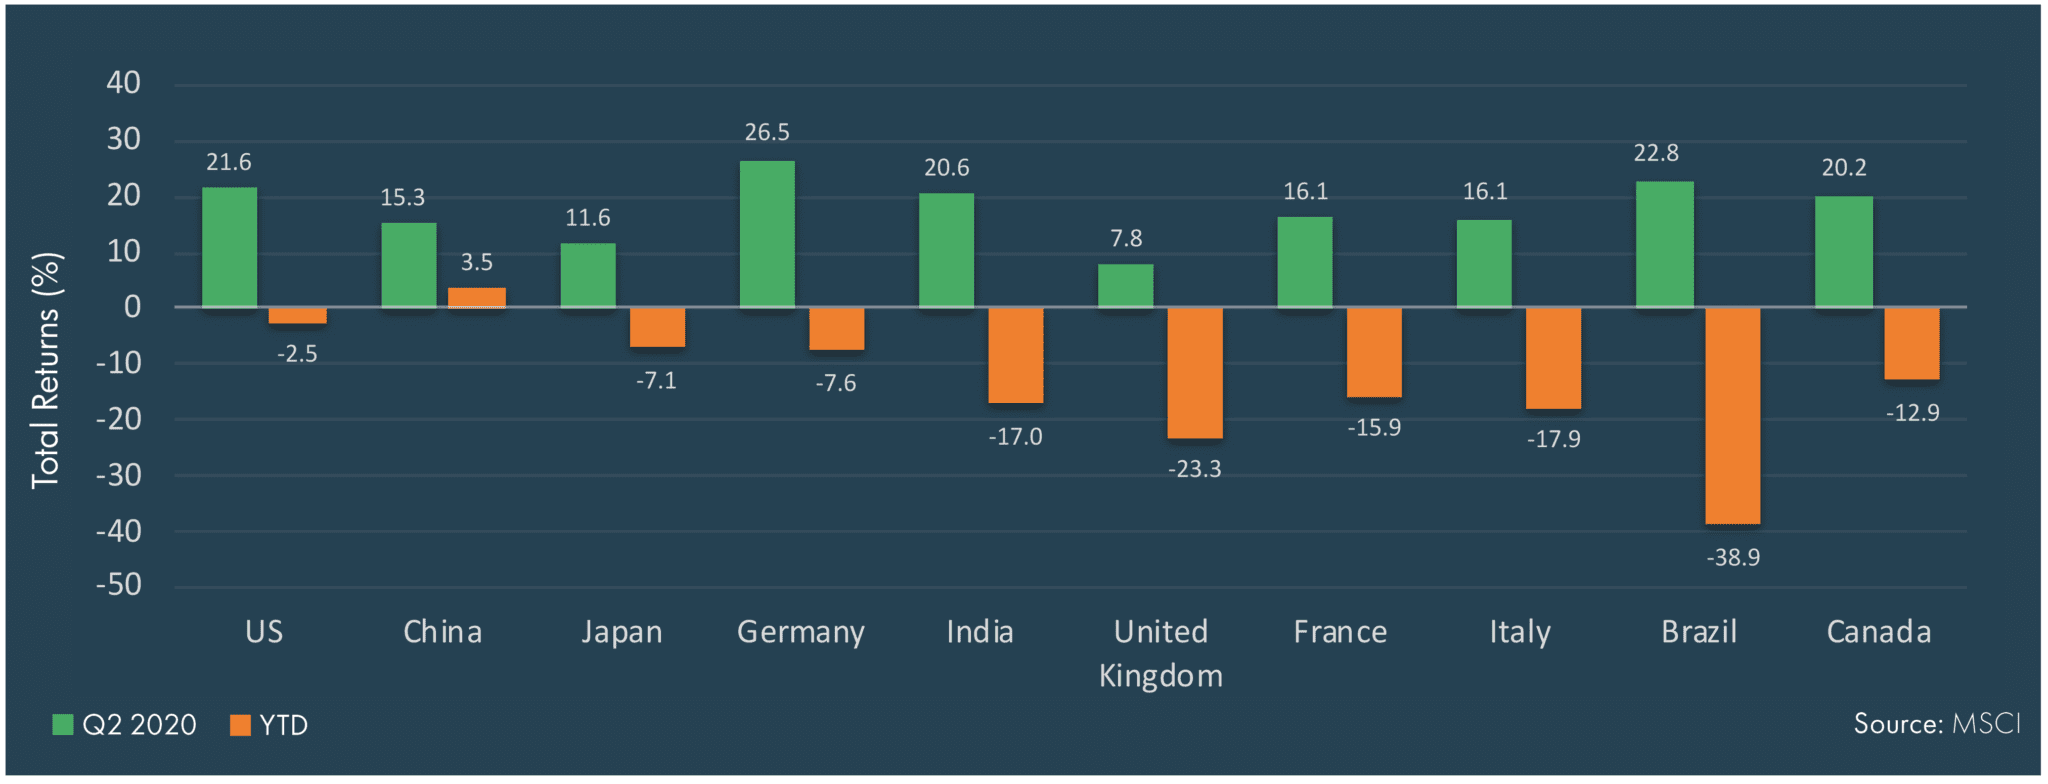
Country Total Returns (%) – Top 10 Largest Economies
Optimism about containment of the virus and reopening was expressed in equity prices across the world, which were all positive in the second quarter. That said, the drop experienced in March has left most countries in negative territory year-to-date.
Alternatives Market Update
Graphic Data Represented As of 6/30/2020
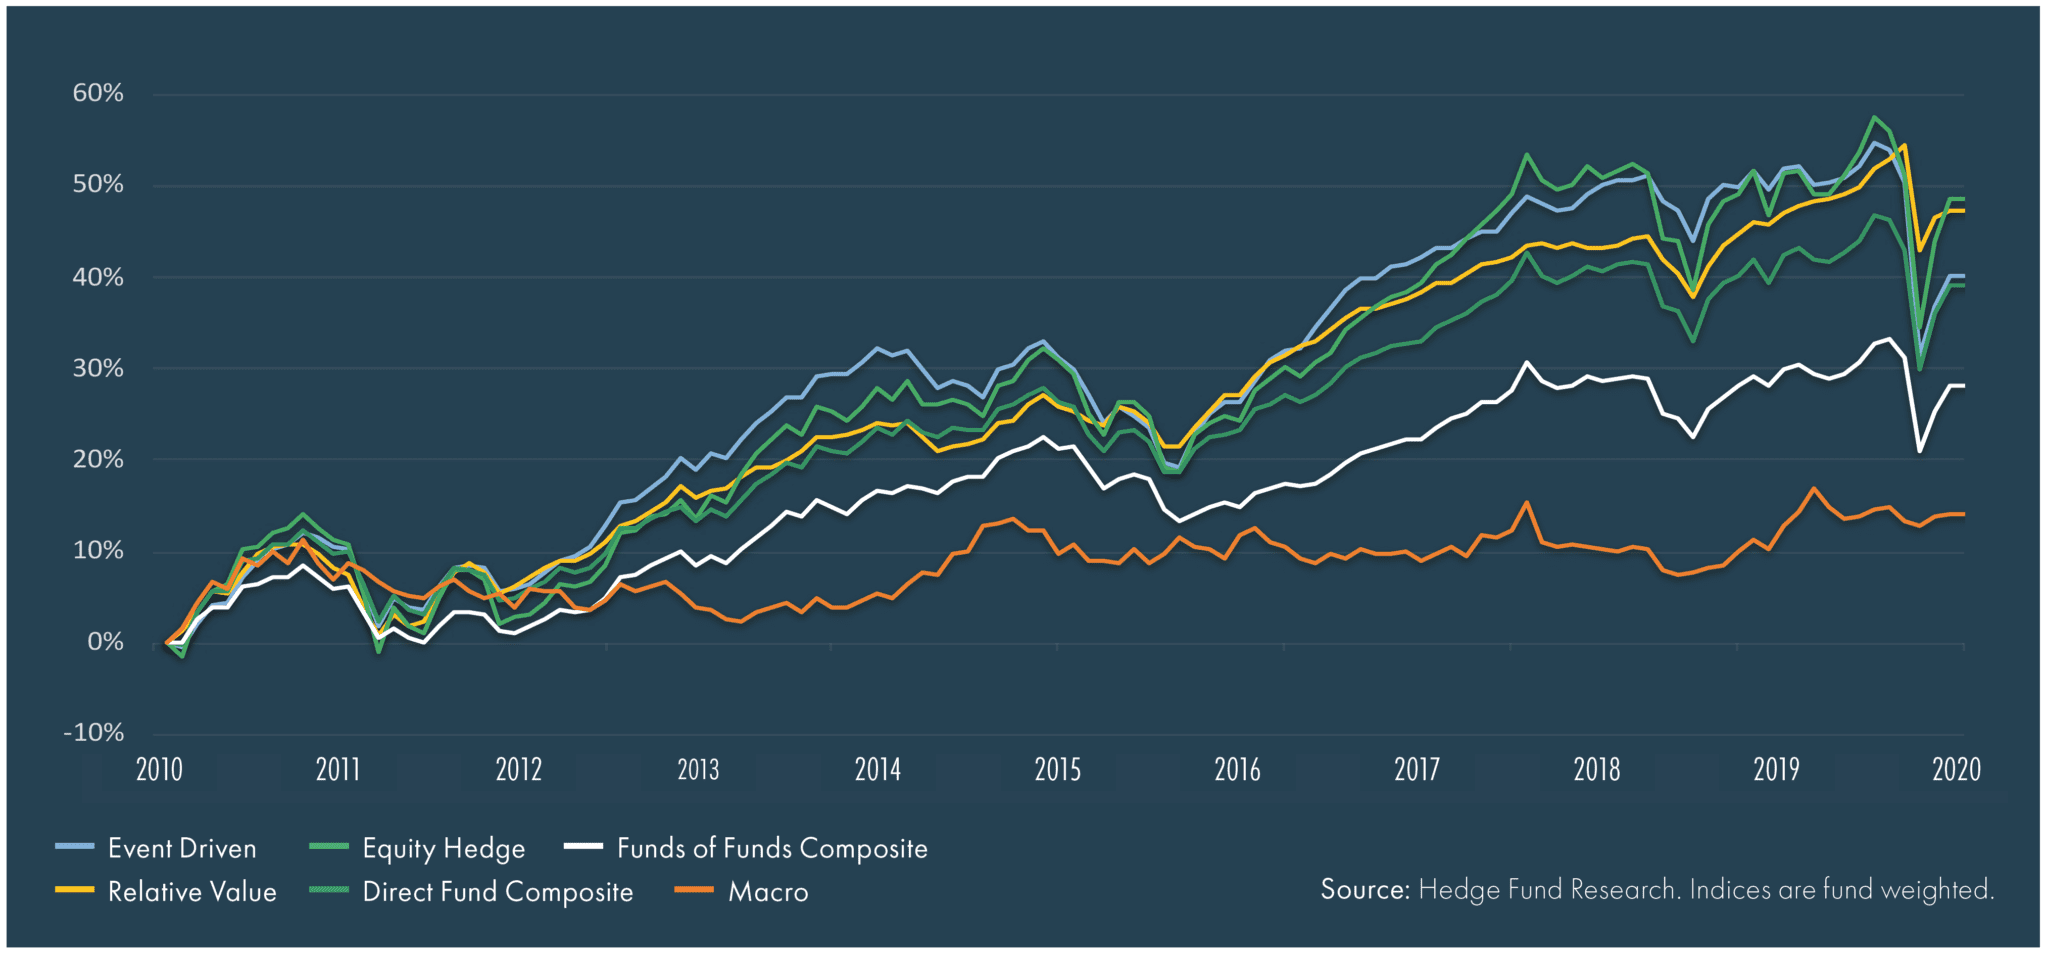
Hedge Fund Cumulative Returns – Trailing 10 Years
Annualized hedge fund returns averaged 2.5% over the last decade, led by Equity Hedge and Relative Value strategies.
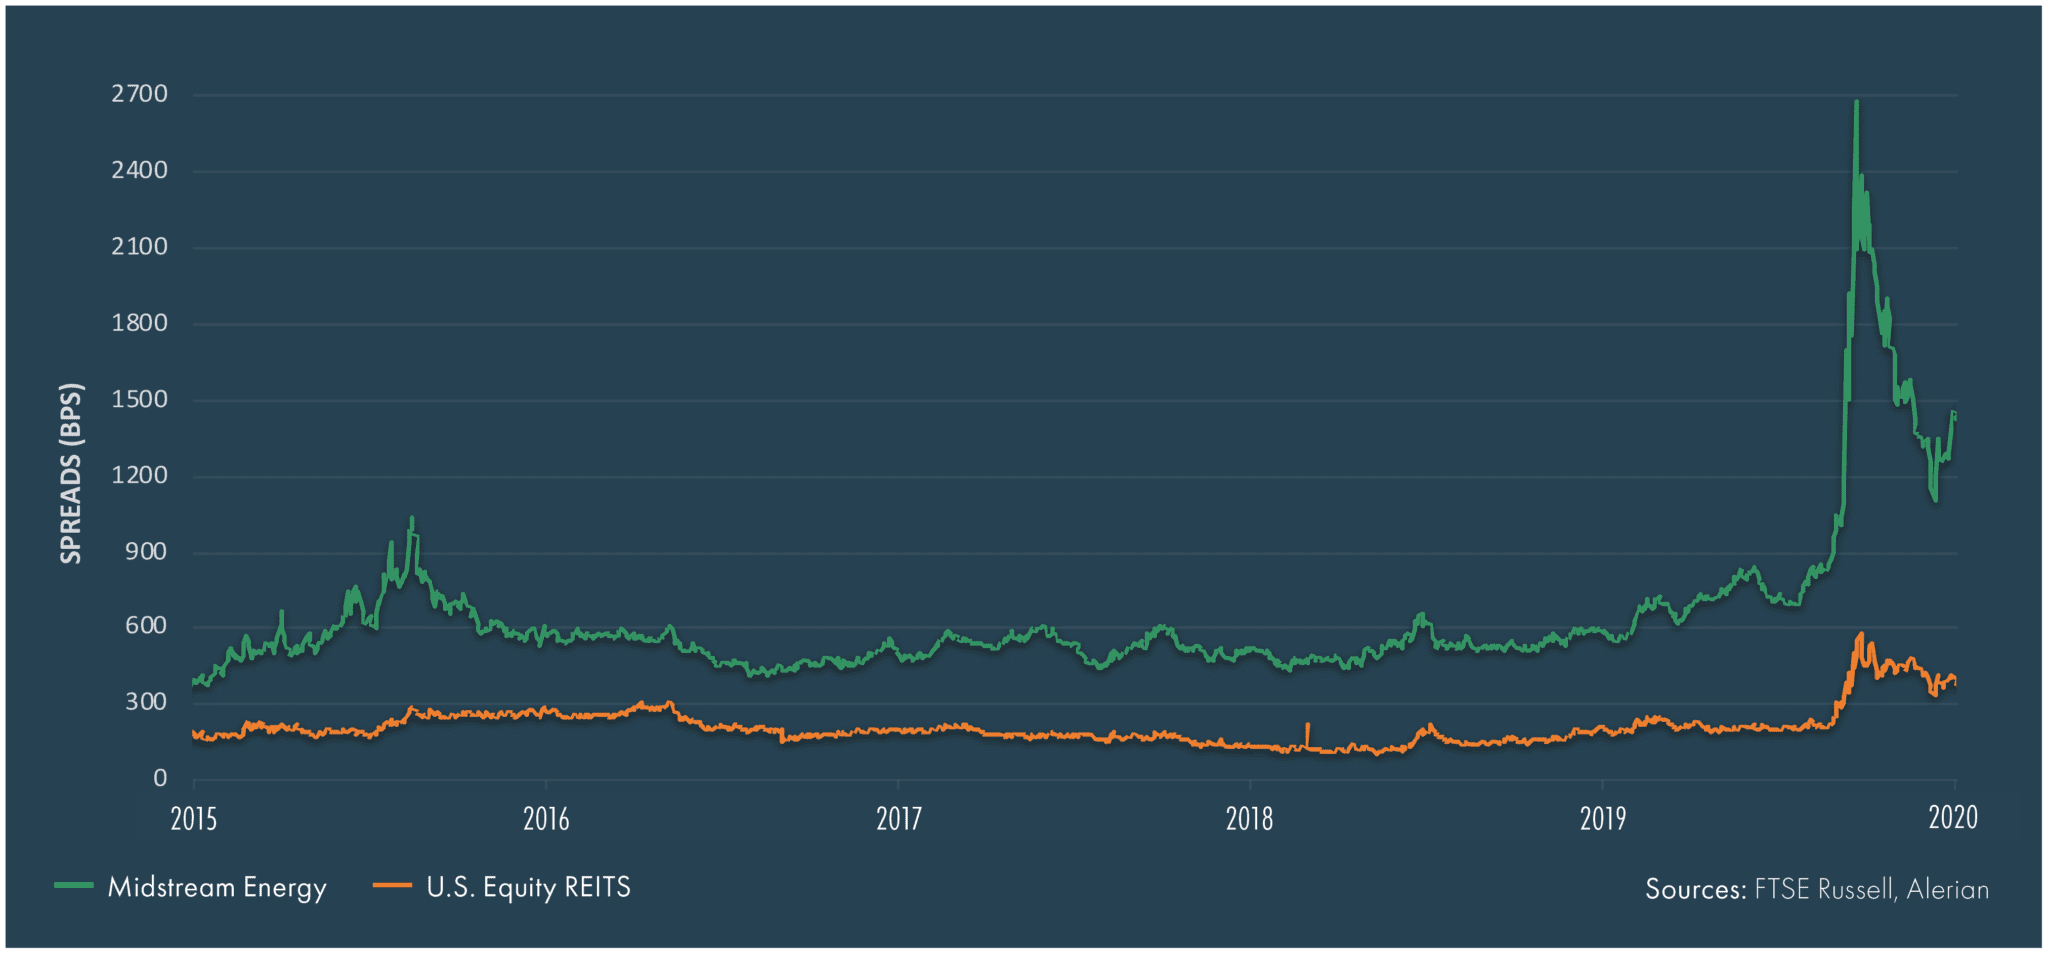
Spreads Over 10-Year Treasury
Midstream energy and real estate investment trust (REIT) spreads tightened in sympathy with other risk assets but remain wide relative to historical standards, particularly midstream energy given recent oil price pressure.
Economic Review Graphic
Data Represented As of 6/30/2020
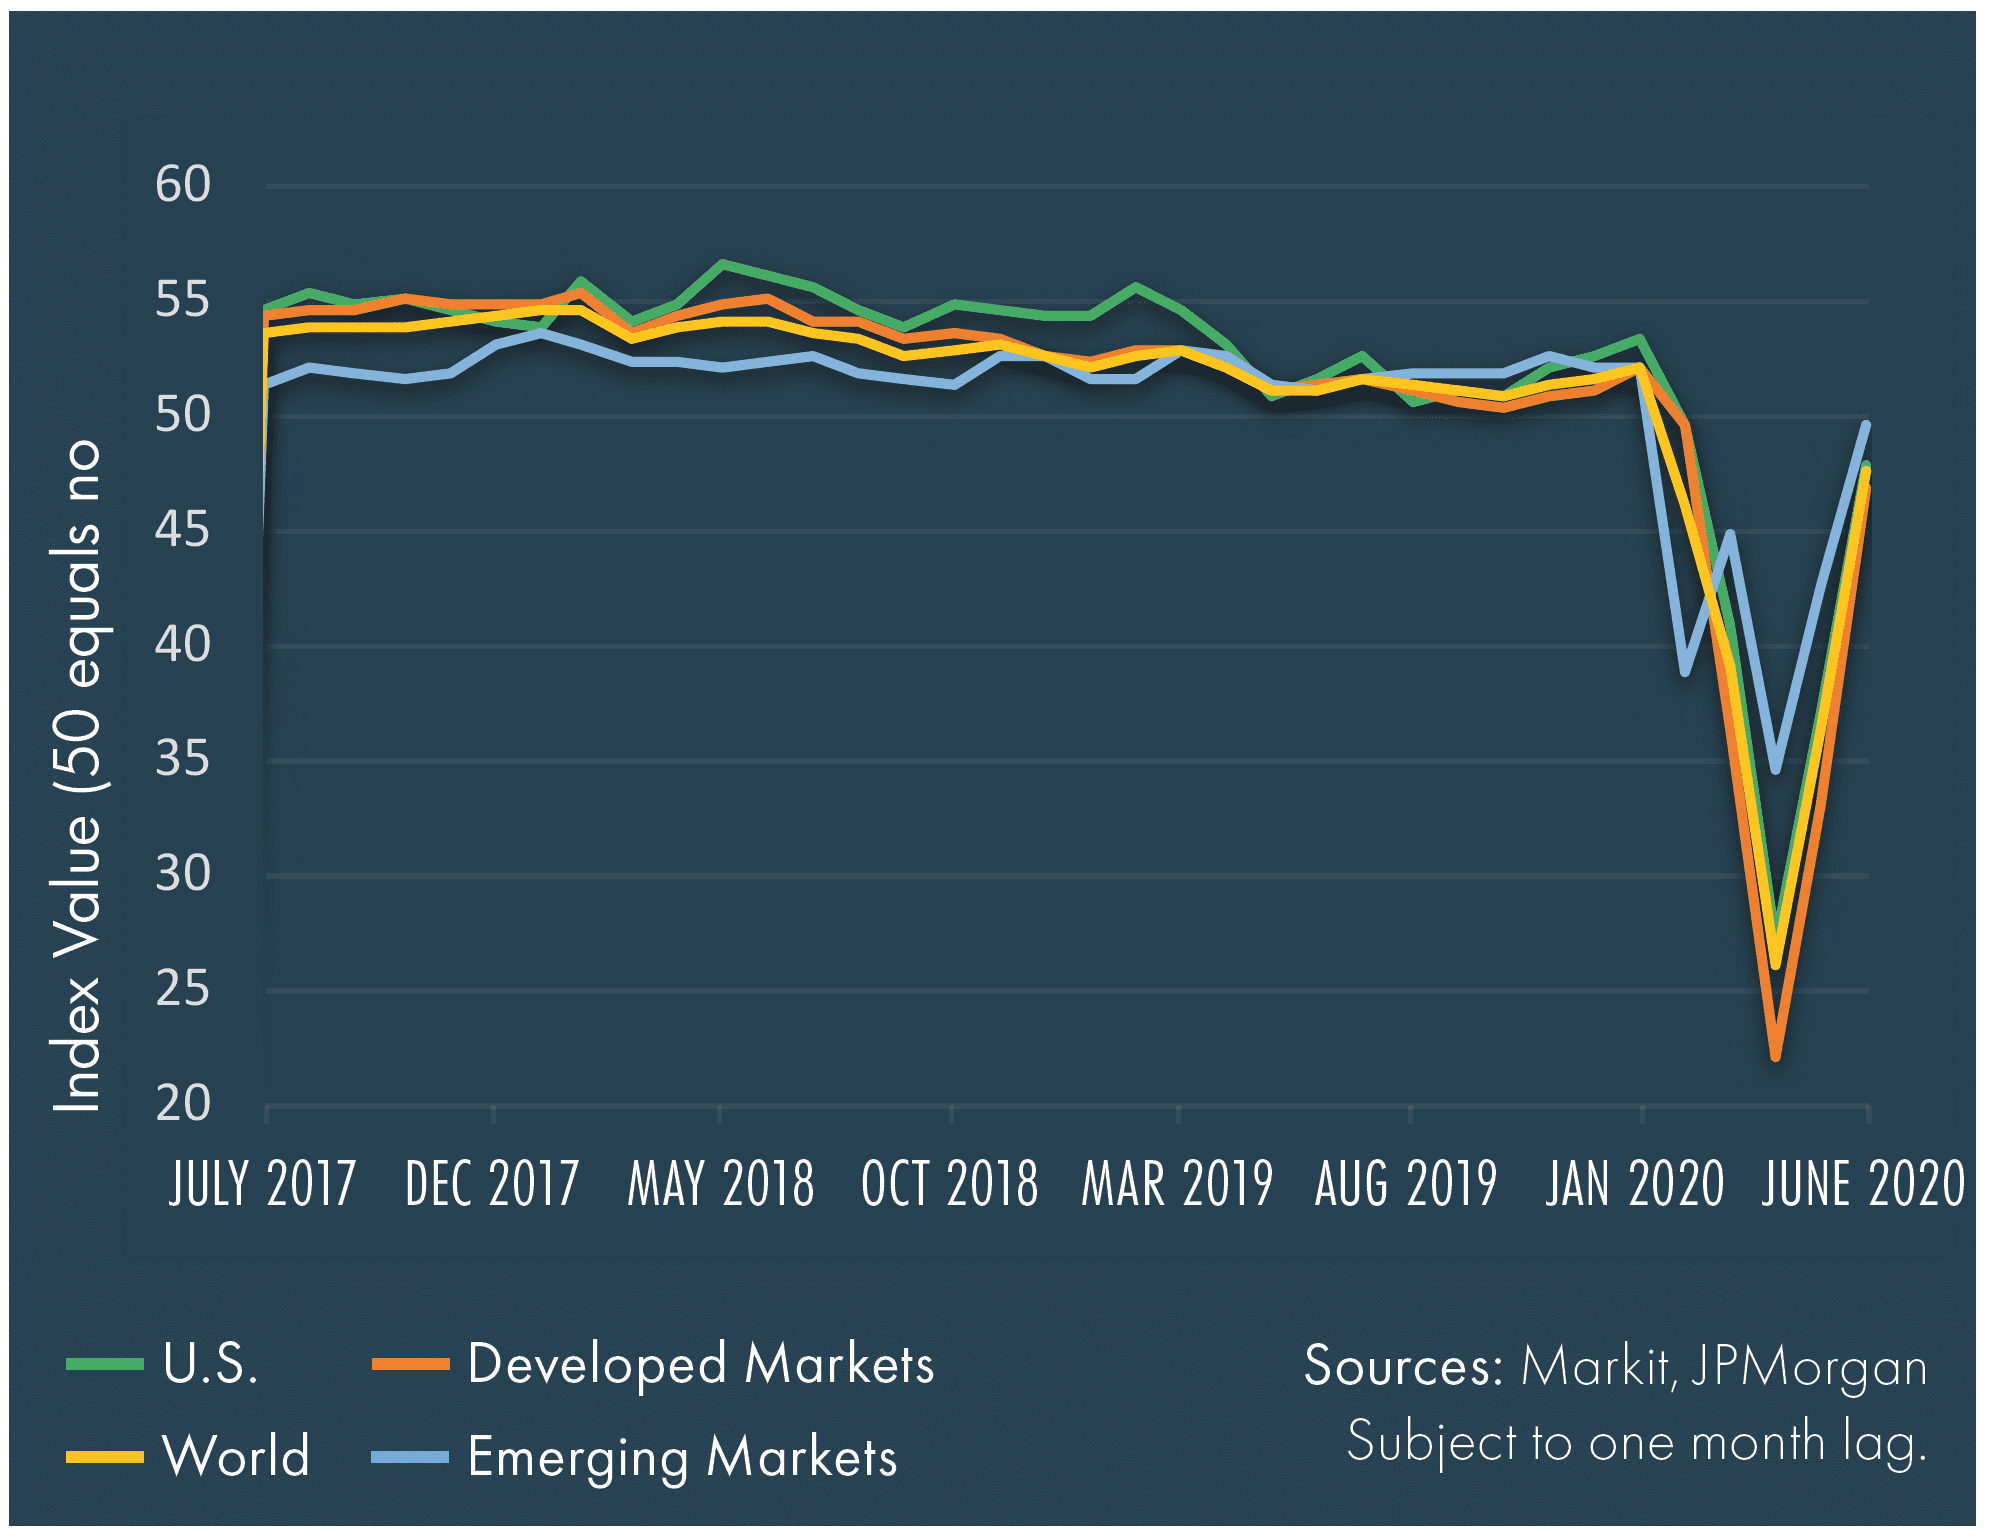
Purchasing Managers Index (PMI) Composites
PMI data revealed progress toward more normal economic activity; however, all indices remain below 50, indicating economic contraction.
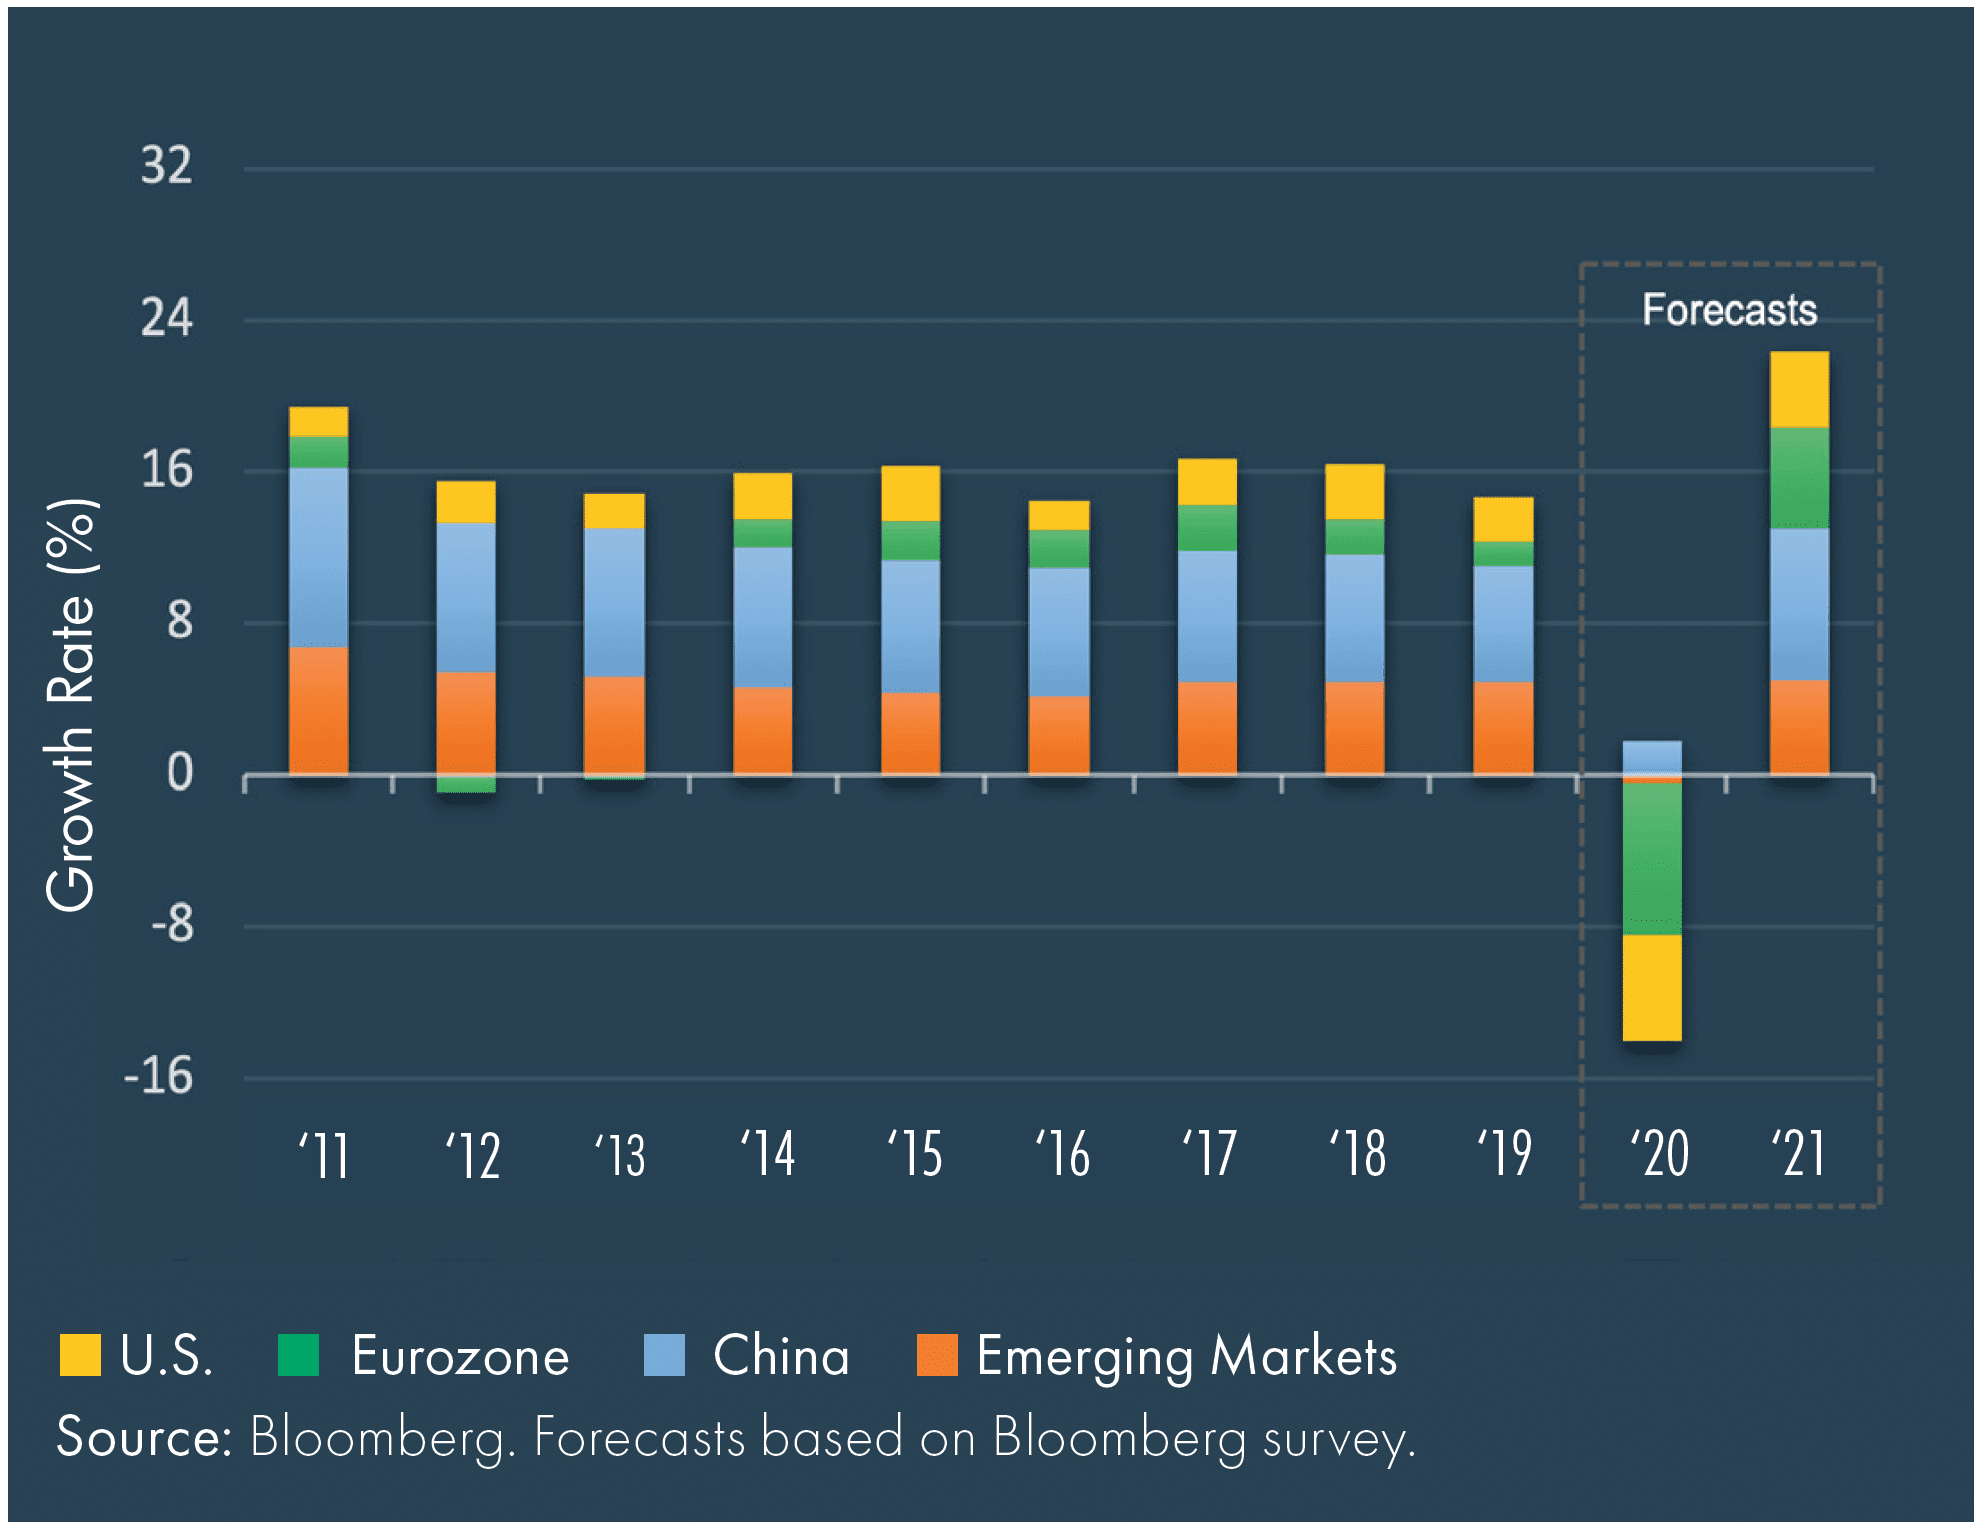
Real Gross Domestic Product (GDP) Growth (YoY)
GDP growth forecasts for 2020 are negative for most of the world except China; however, 2021 estimates are more optimistic.
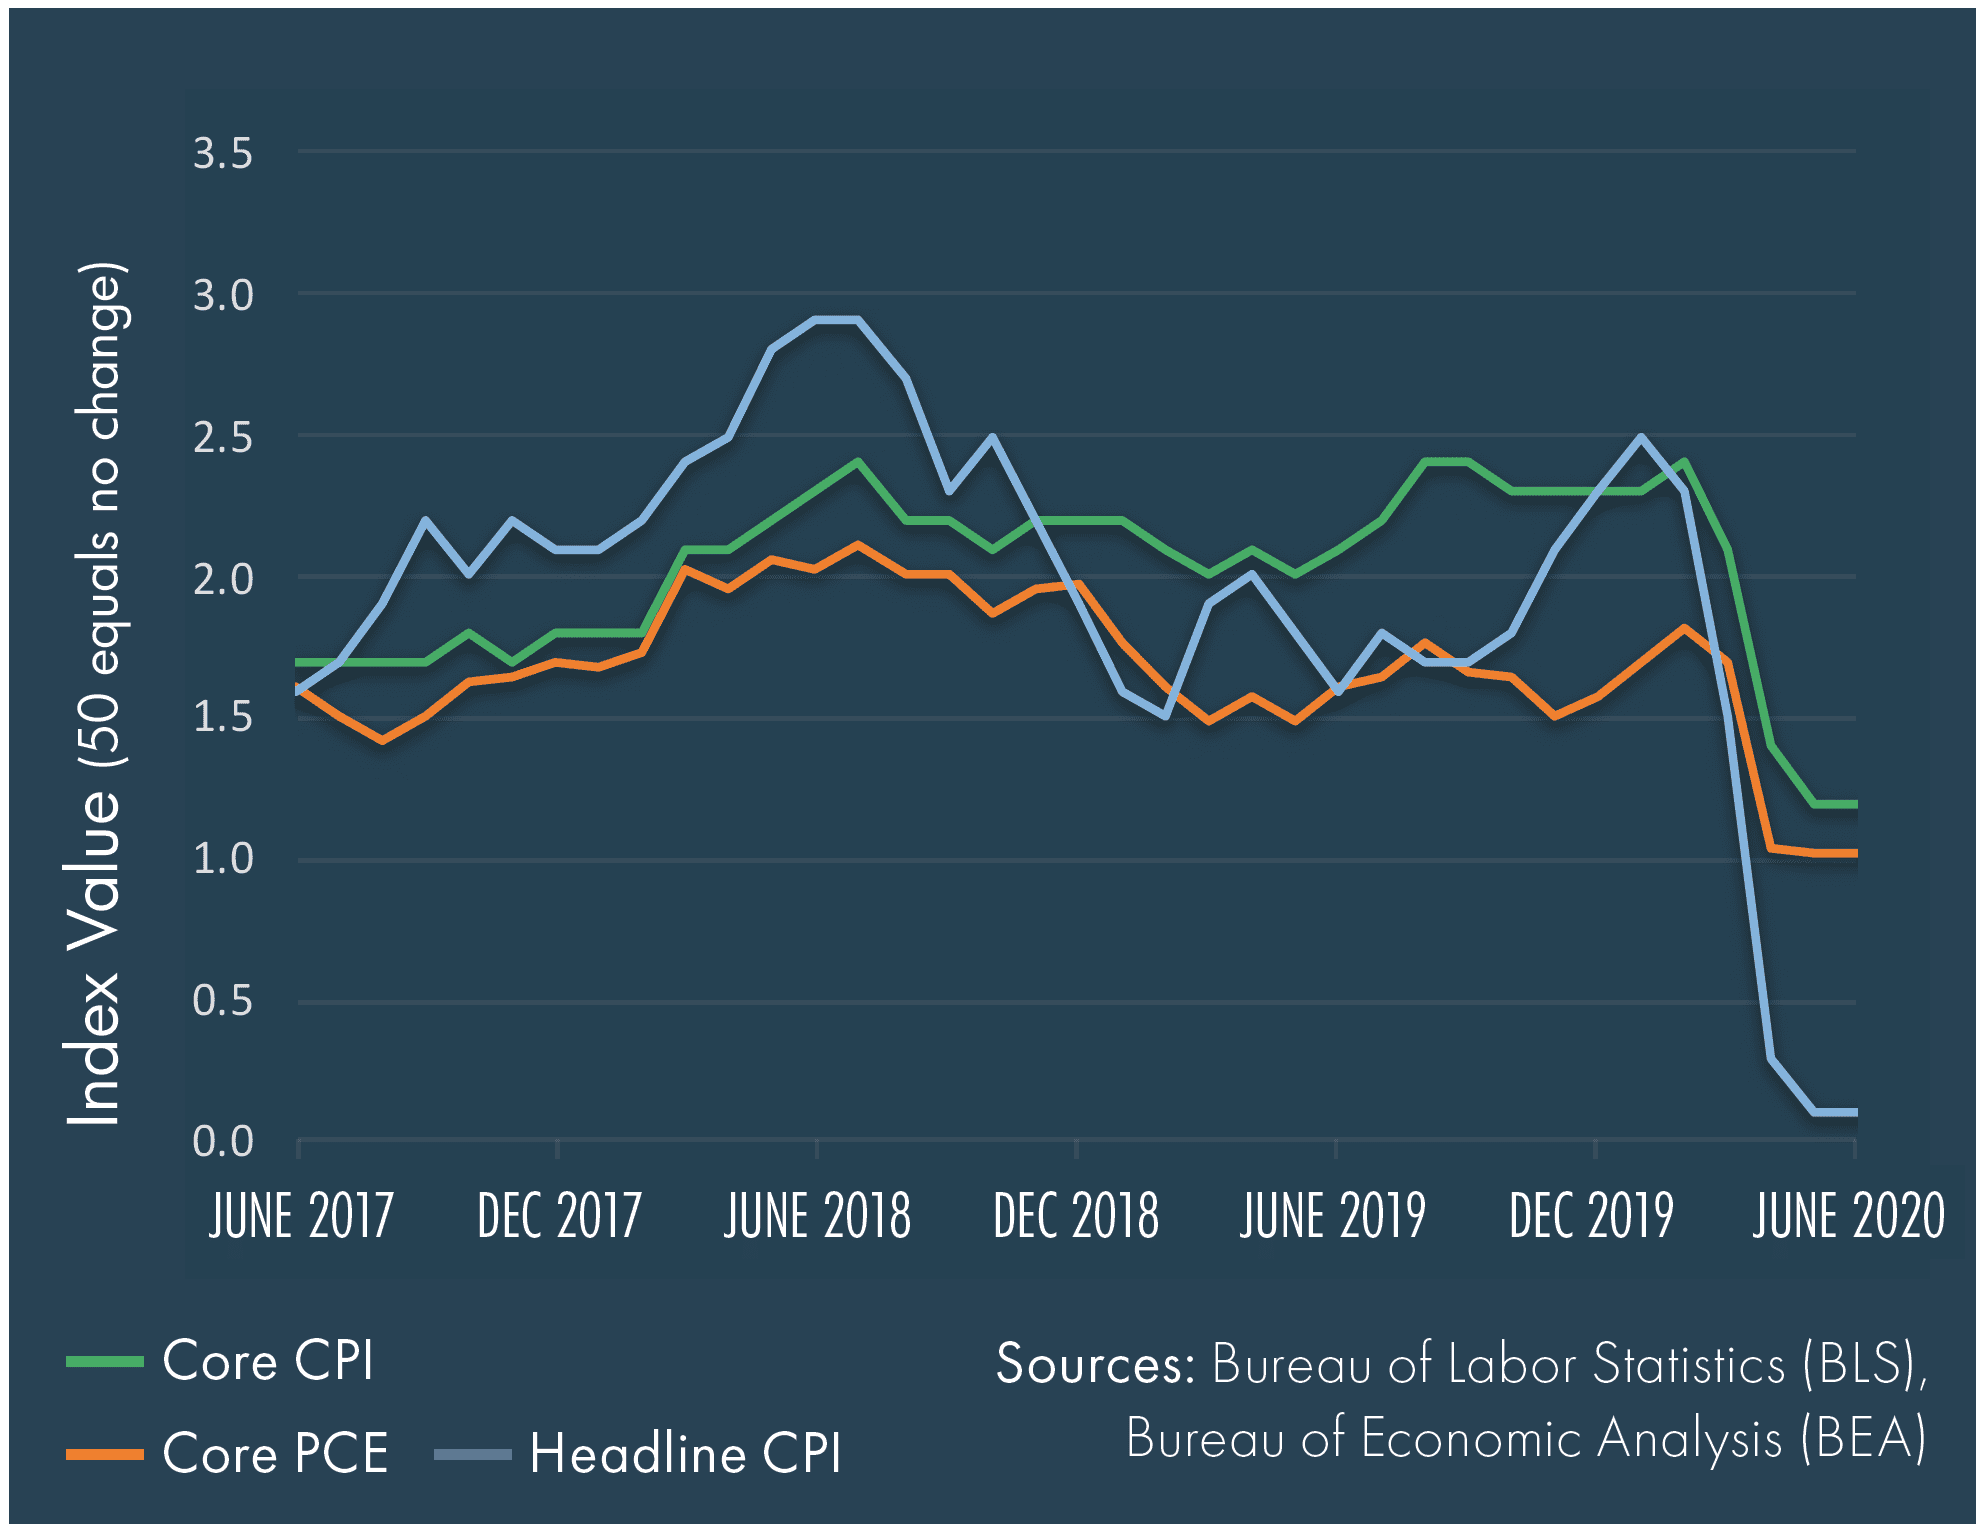
U.S Inflation
Core inflation dropped off amid the decline in demand given the shutdown. The headline Consumer Price Index (CPI) fell even further with the drop in oil prices.
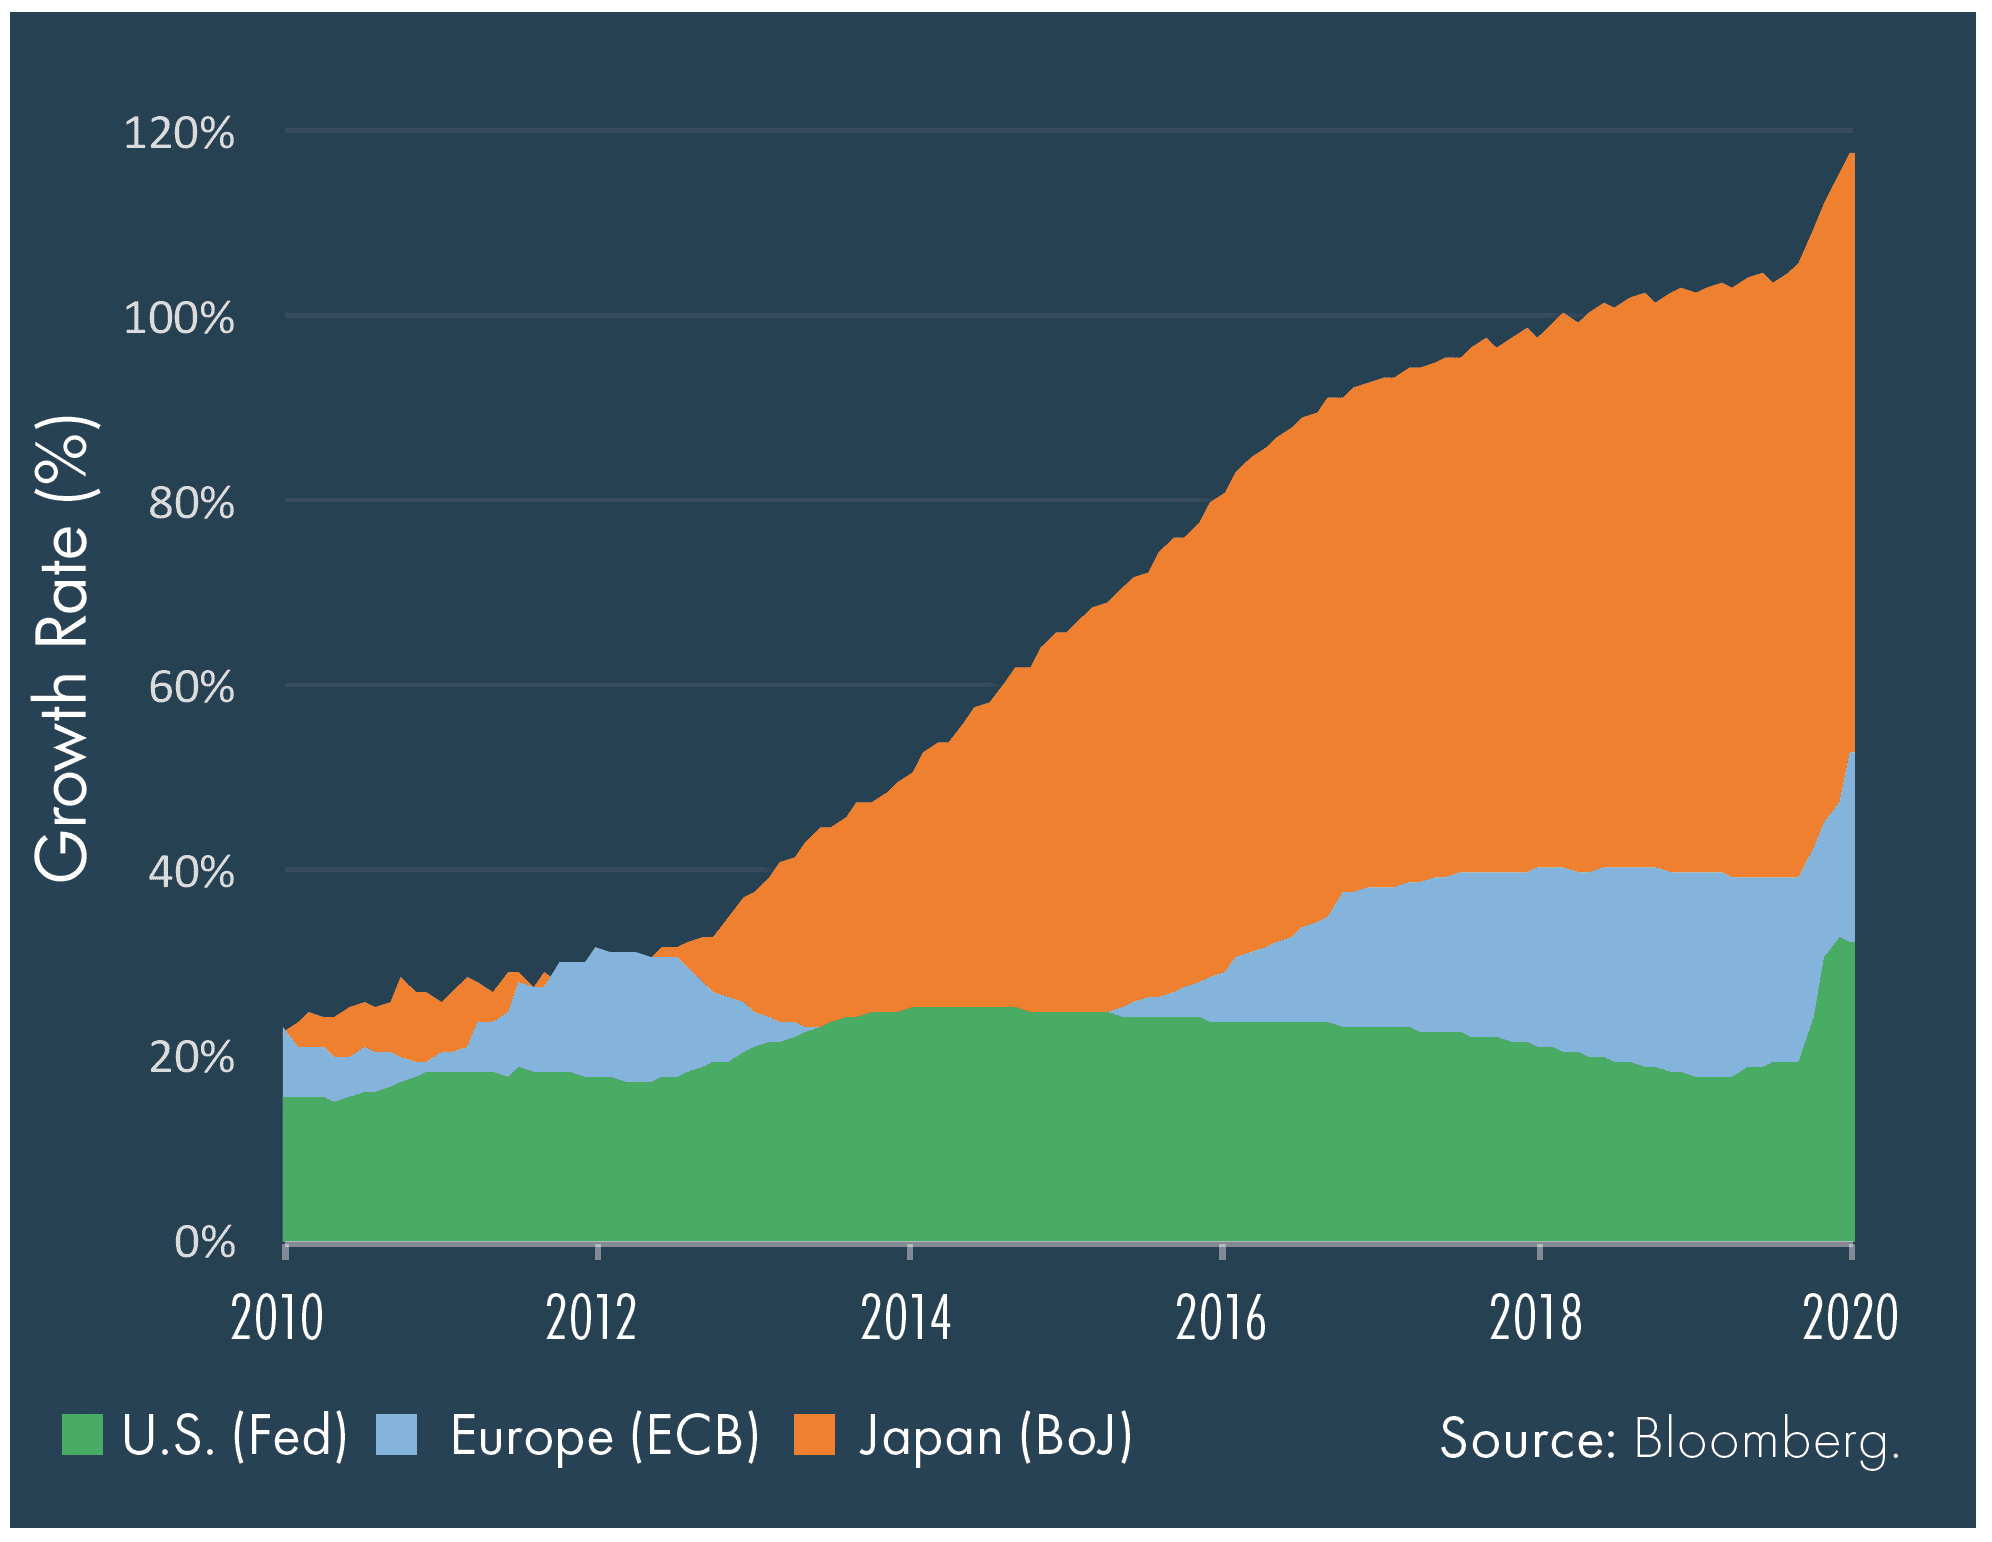
Central Bank Balance Sheets as a Percent of GDP
Despite unprecedented levels of monetary easing, the Fed has a lot more policy room to support economic activity.
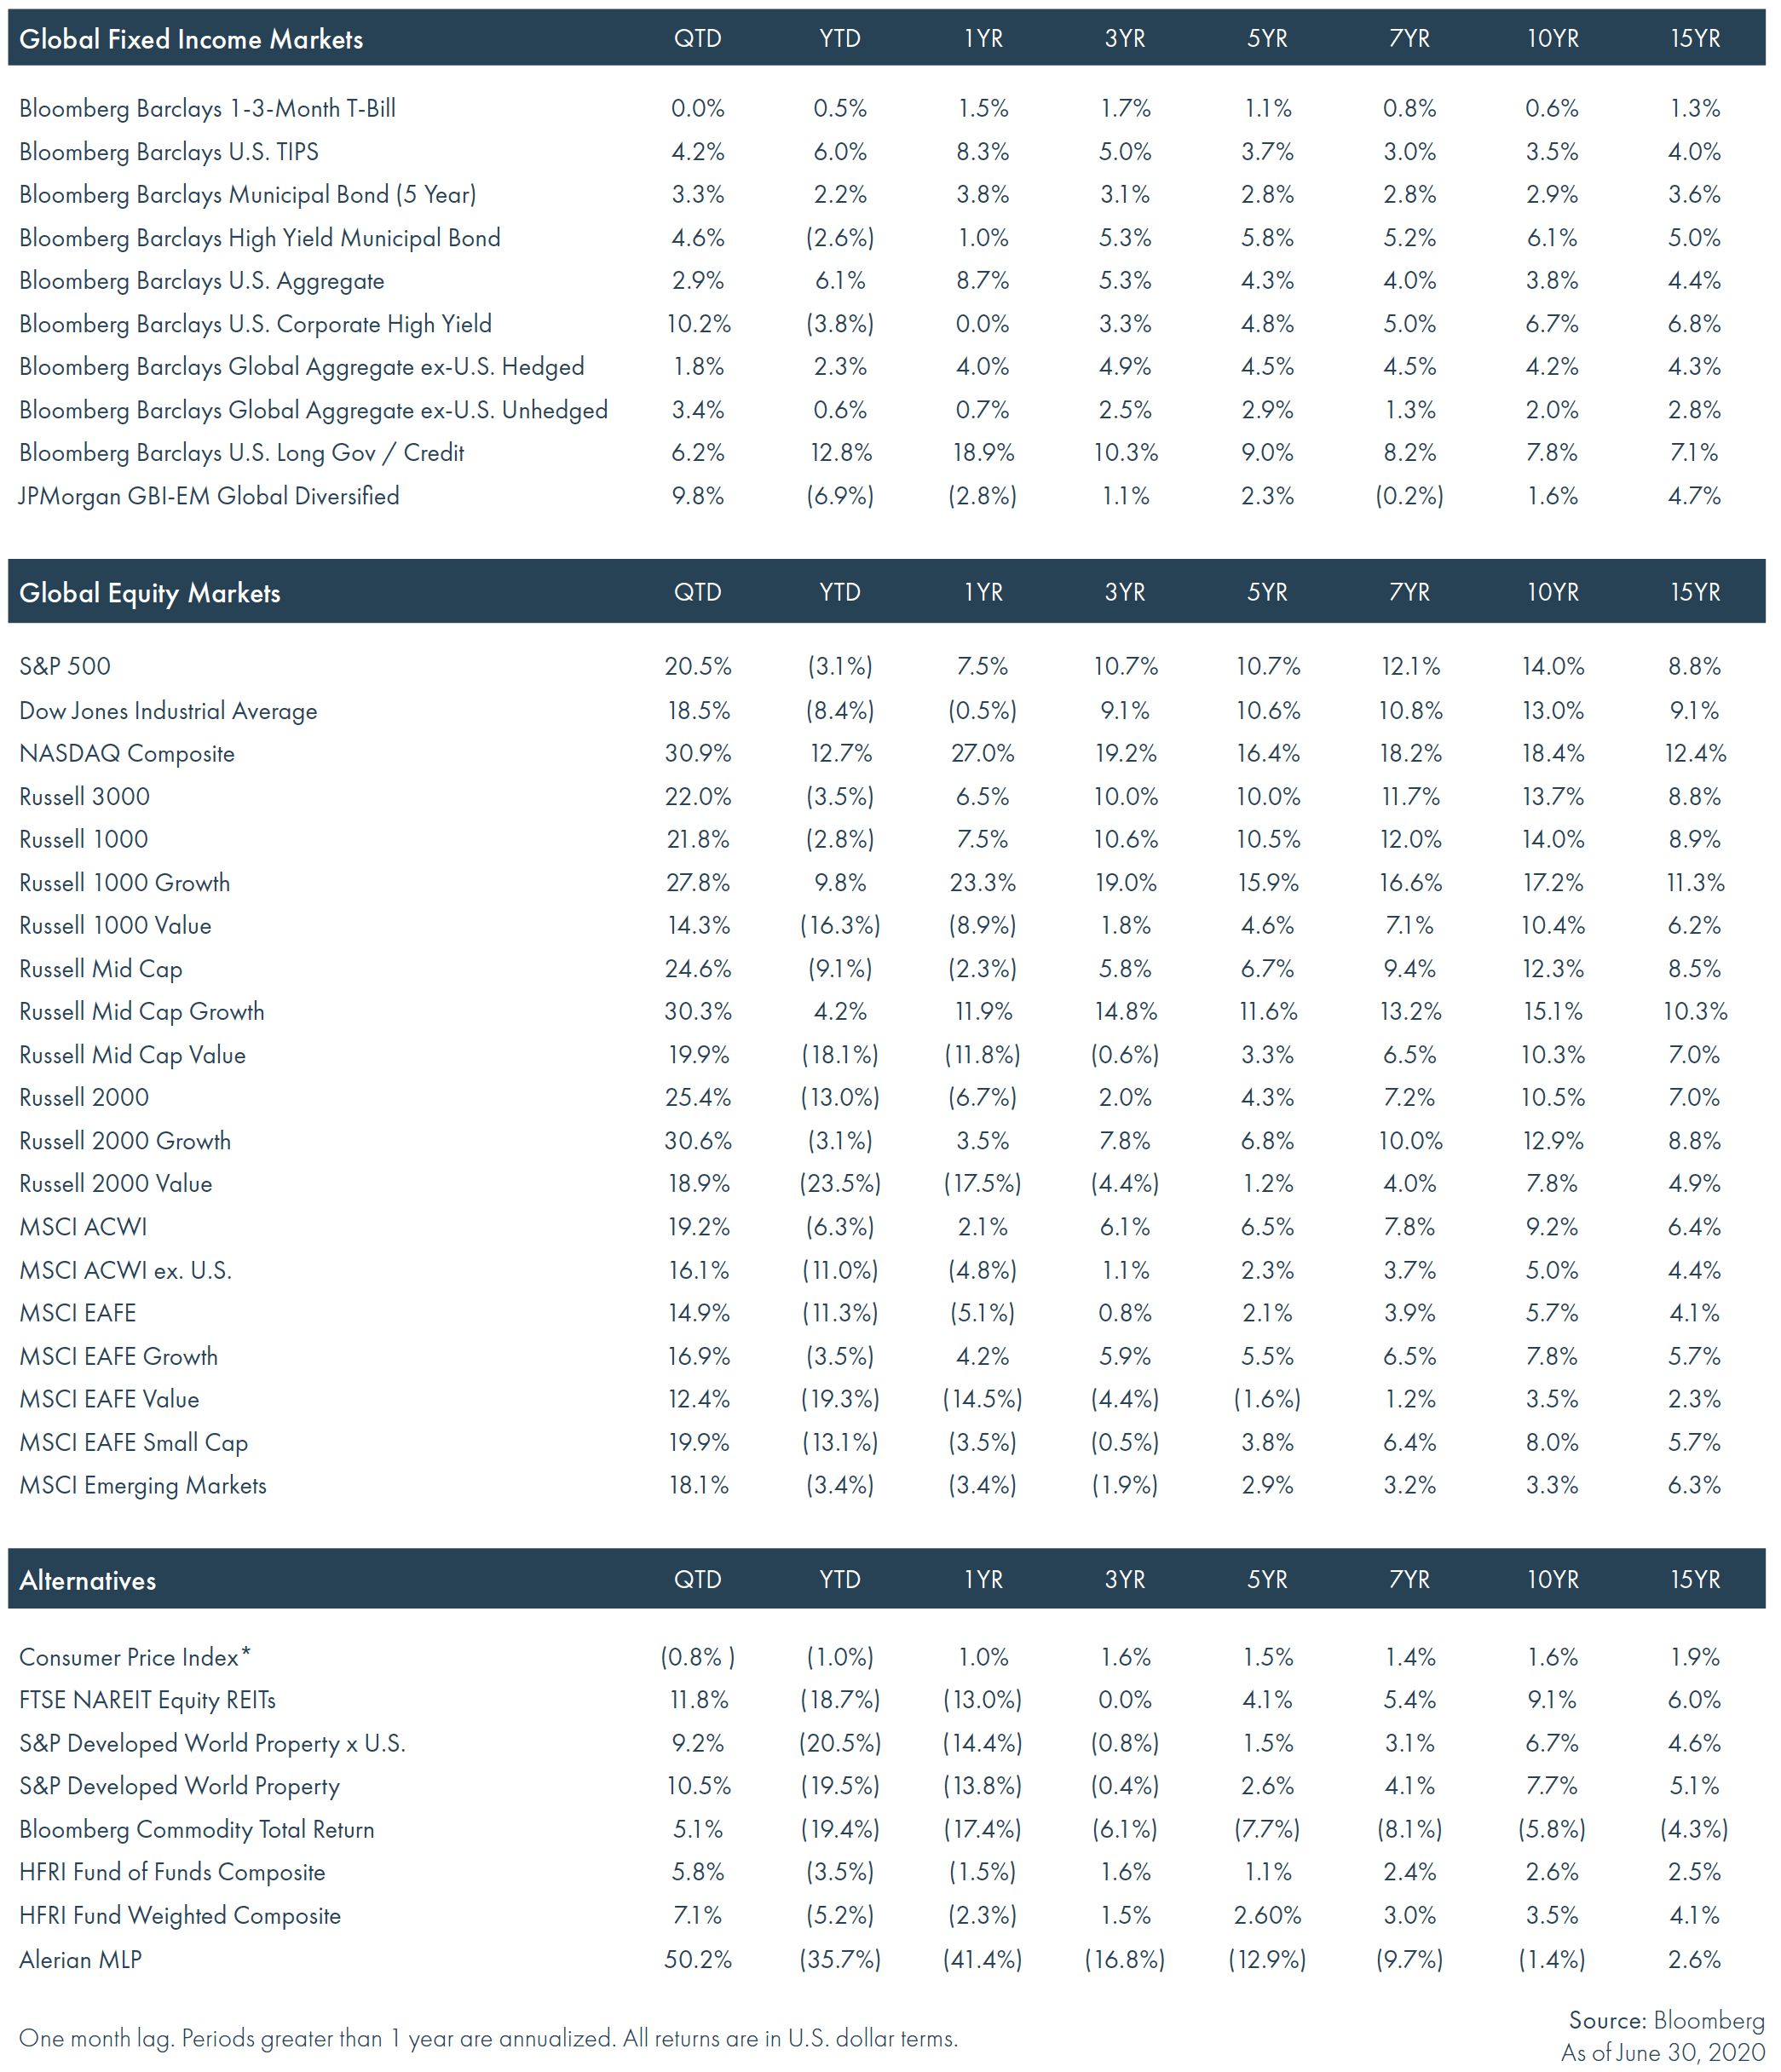
Financial Market Performance
Periods greater than one year are annualized. All returns are in U.S. dollar terms.
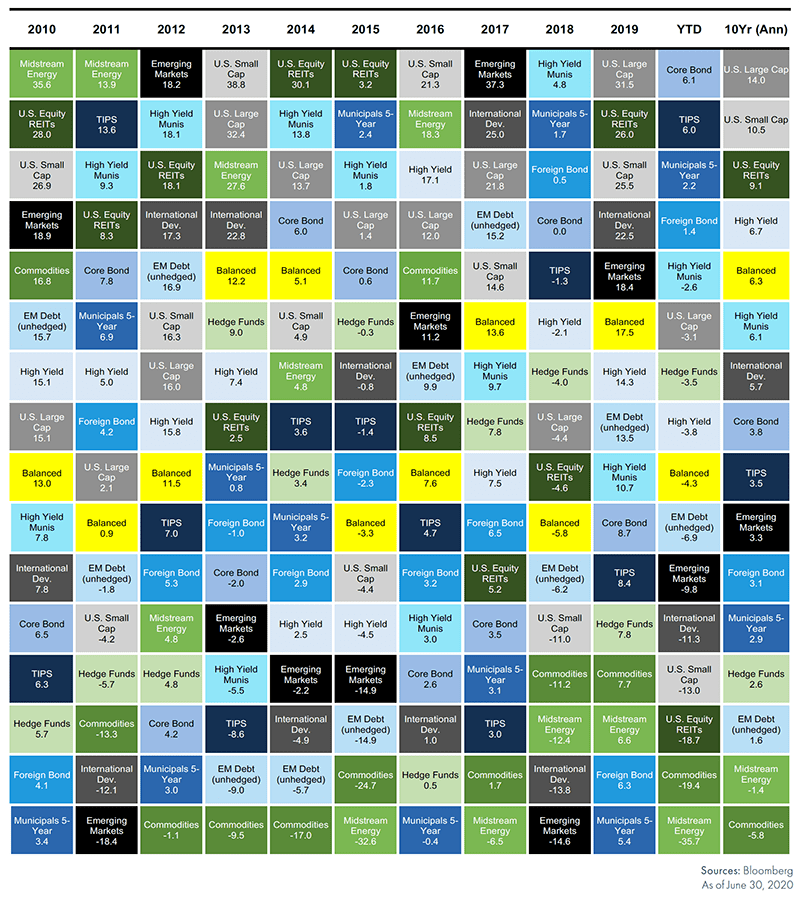
Why Diversify?
YEAR-BY-YEAR PERFORMANCE RANKINGS OF ASSET CLASSES
These materials have been prepared for informational purposes only based on materials deemed reliable, but the accuracy of which has not been verified. Past performance is not indicative of future returns. You cannot invest directly in an index. These materials do not constitute an offer or recommendation to buy or sell securities, and do not take into consideration your circumstances, financial or otherwise. You should consult with an appropriately credentialed investment professional before making any investment decision.